Function app 51
Plot the
functions
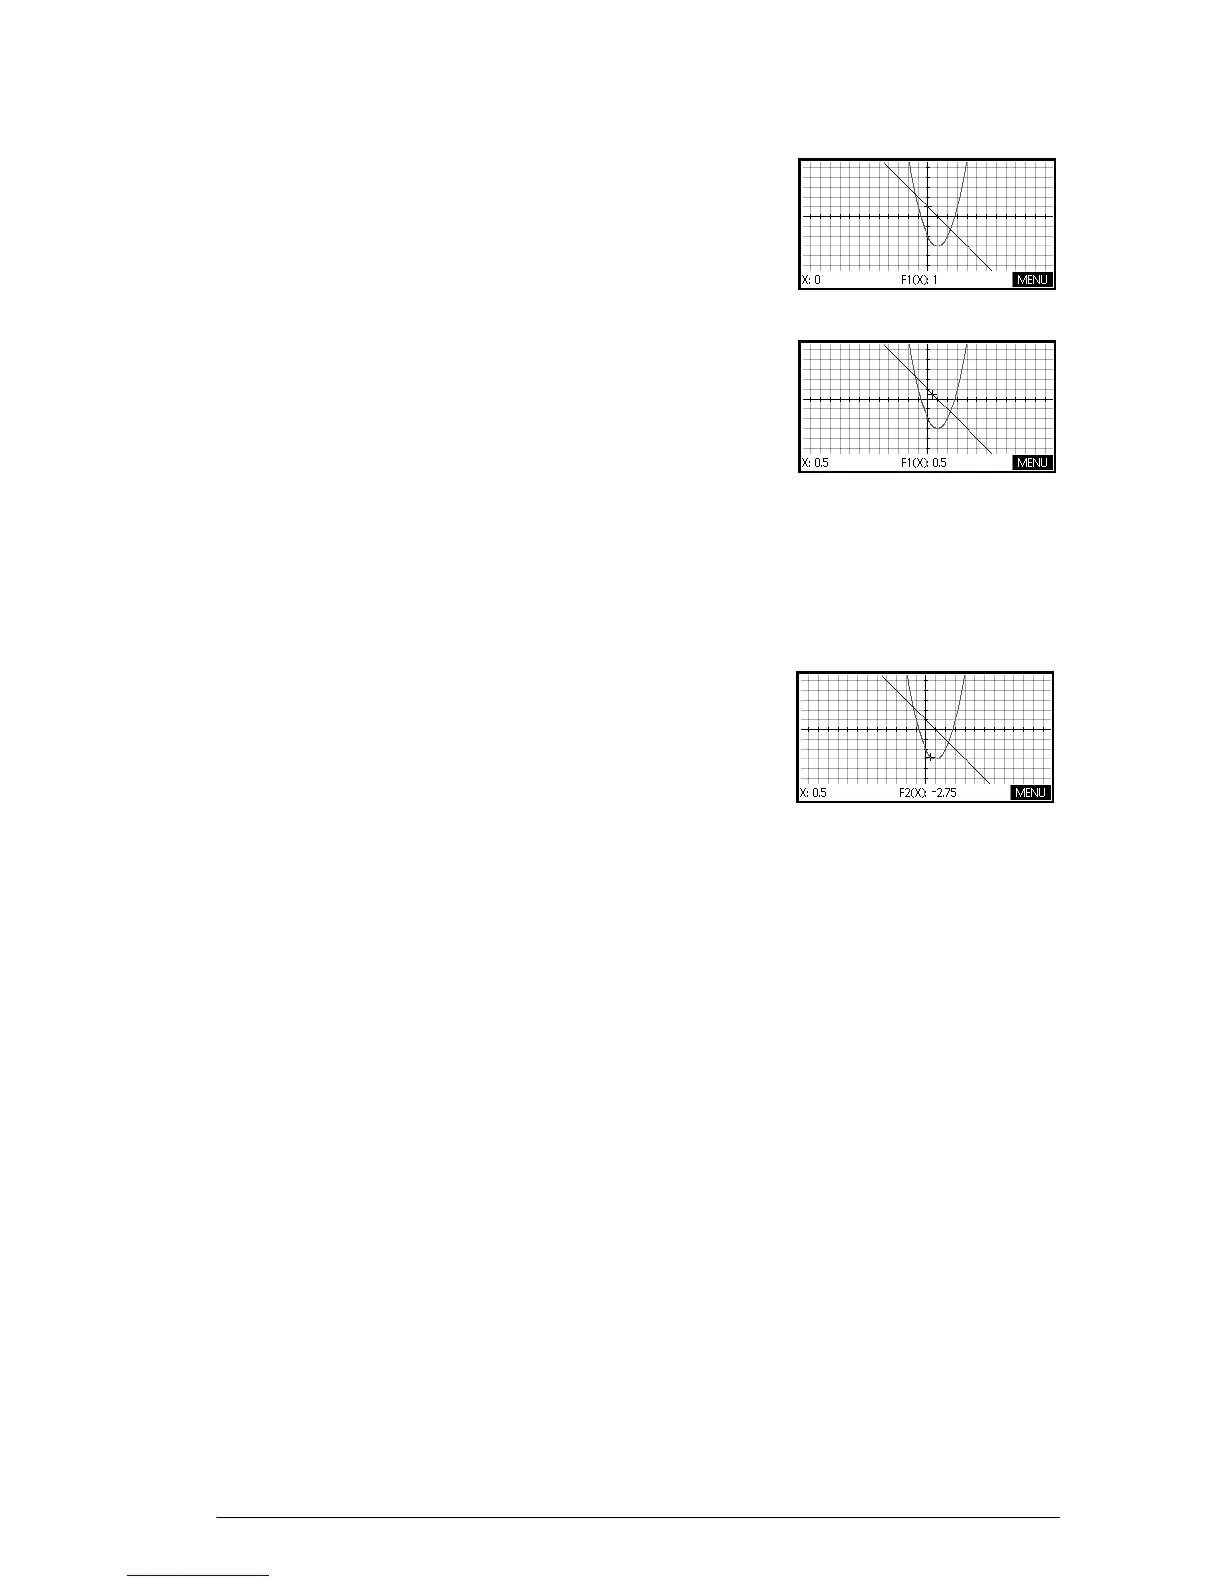
5. Plot the functions.
P
Trace a graph 6. Trace the linear function.
>or<
Note: by default, the tracer is active.
7. Jump from tracing the linear function to the quadratic
function.
=or\
Change the
scale
You can change the scale to see more or less of your
graph. This can be done in four ways:
• Press+to zoom in orwto zoom out on the
current cursor coordinates. This method uses the zoom
factors set in the Zoom menu. The default for both x
and y is 2.
• Use the Plot Setup to define XRNG and YRNG exactly
as you want.
• Use the Zoom menu to zoom in or out, horizontally or
vertically, or both, etc.
• Use the Views menu to select a pre-defined window.
You can also use Autoscale, in either the Zoom or Views
menus, to choose a vertical range for the current
horizontal range, based on your function definitions.