Statistics 2Var app 85
You can create up to five explorations of two-variable
data, named S1 to S5. In this example, we will create
just one: S1.
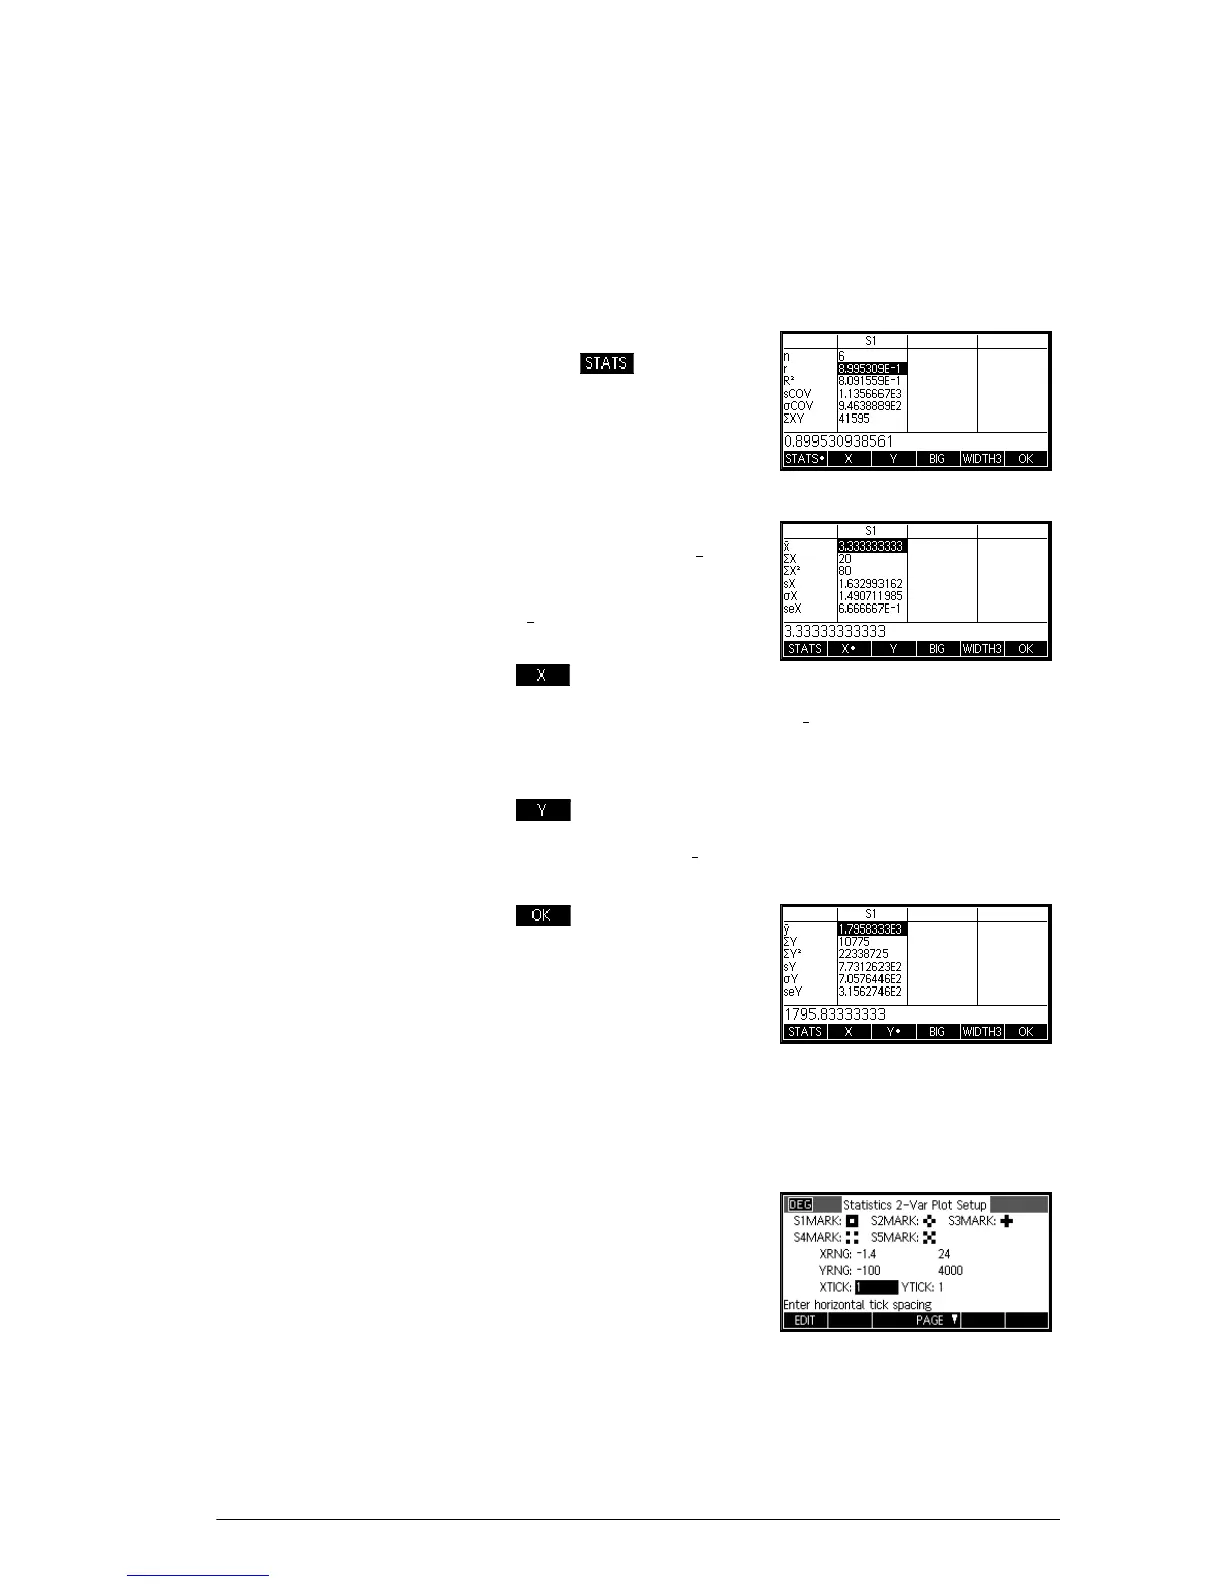
Explore statistics 5. Find the correlation, r, between advertising time and
sales.
M
The correlation is
r=0.8995…
6. Find the mean
advertising time ( )
and the mean sales
().
The mean advertising time, , is approximately 3.3
minutes.
The mean sales, , is approximately $1,796.
Setup plot 7. Change the plotting range to ensure all the data
points are plotted (and select a different point mark, if
you wish).
SSETUP-PLOT
\
-
100E
4000E