86 Statistics 2Var app
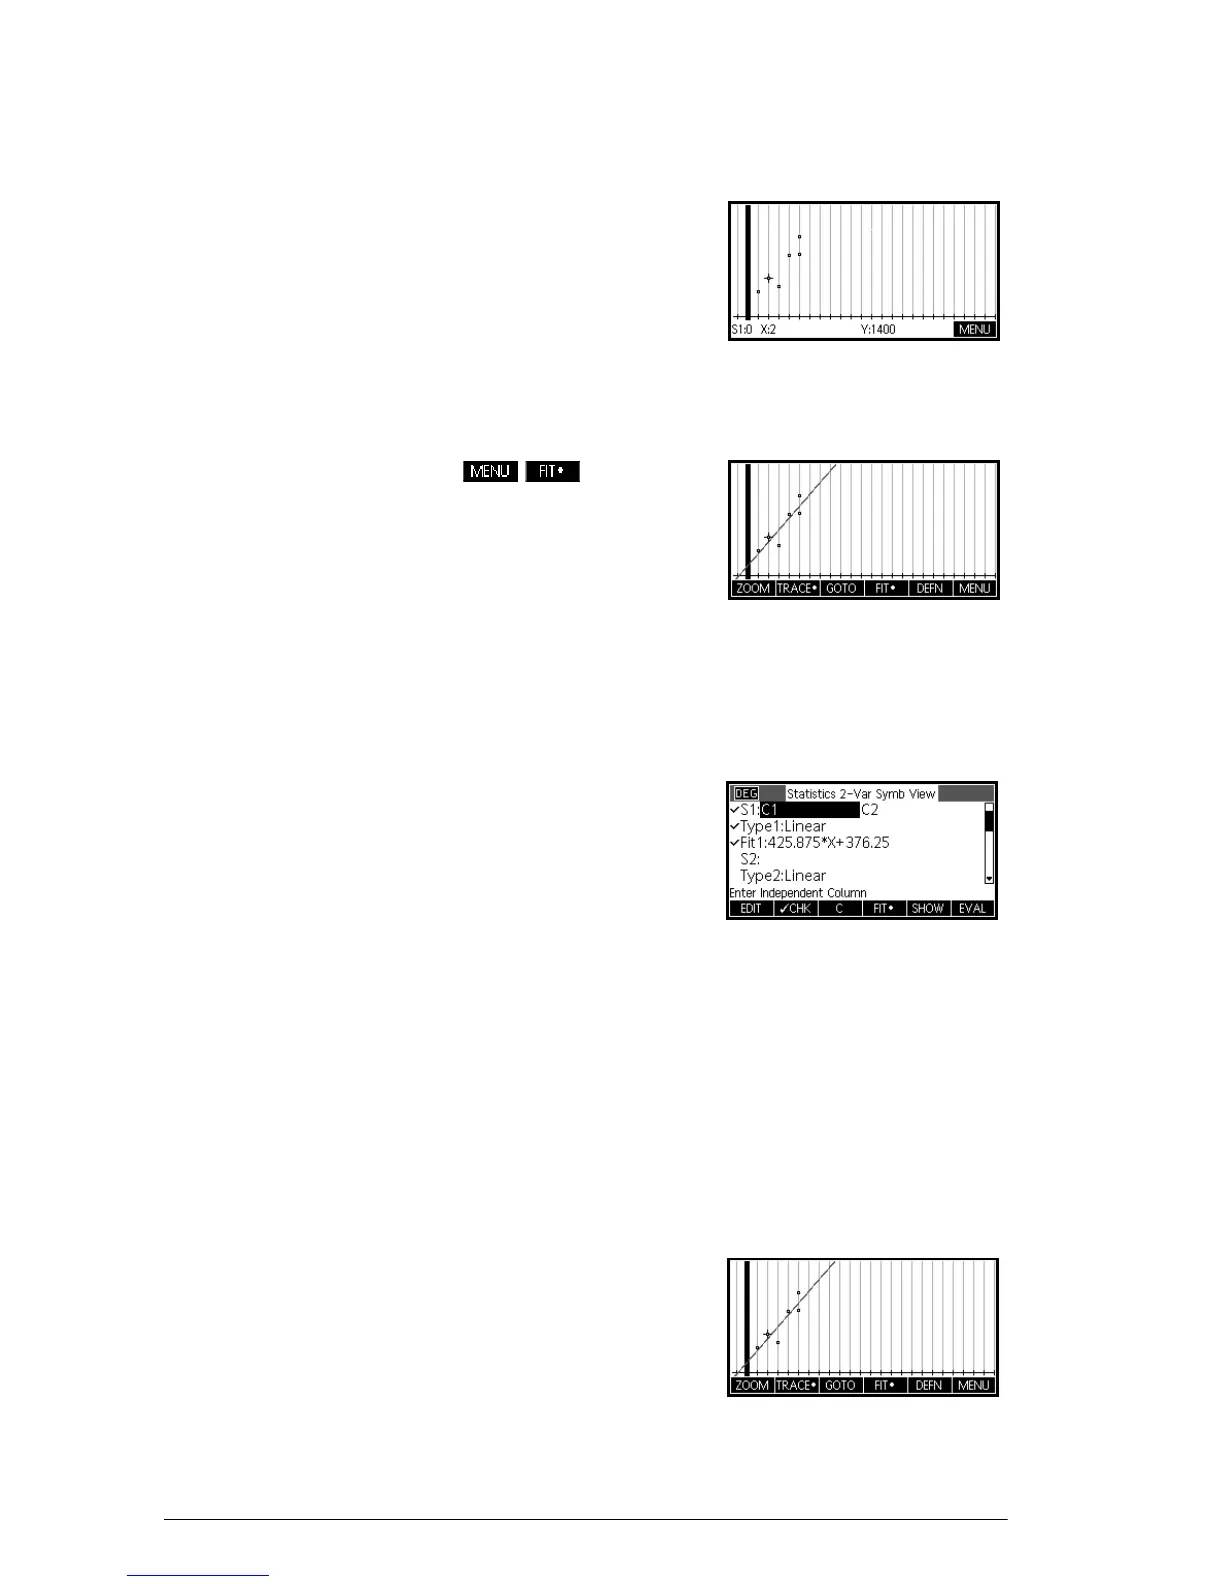
Plot the graph 8. Plot the graph.
P
Draw the
regression curve
9. Draw the regression curve (a curve to fit the data
points).
This draws the
regression line for the best linear fit.
Display the
equation
10. Return to the Symbolic view.
Y
The slope (m) is 425.875. The y-intercept (b) is
376.25.
Predict values
Predict the sales figure if advertising were to go up to 6
minutes.
11. Return to the Plot view.
P
 Loading...