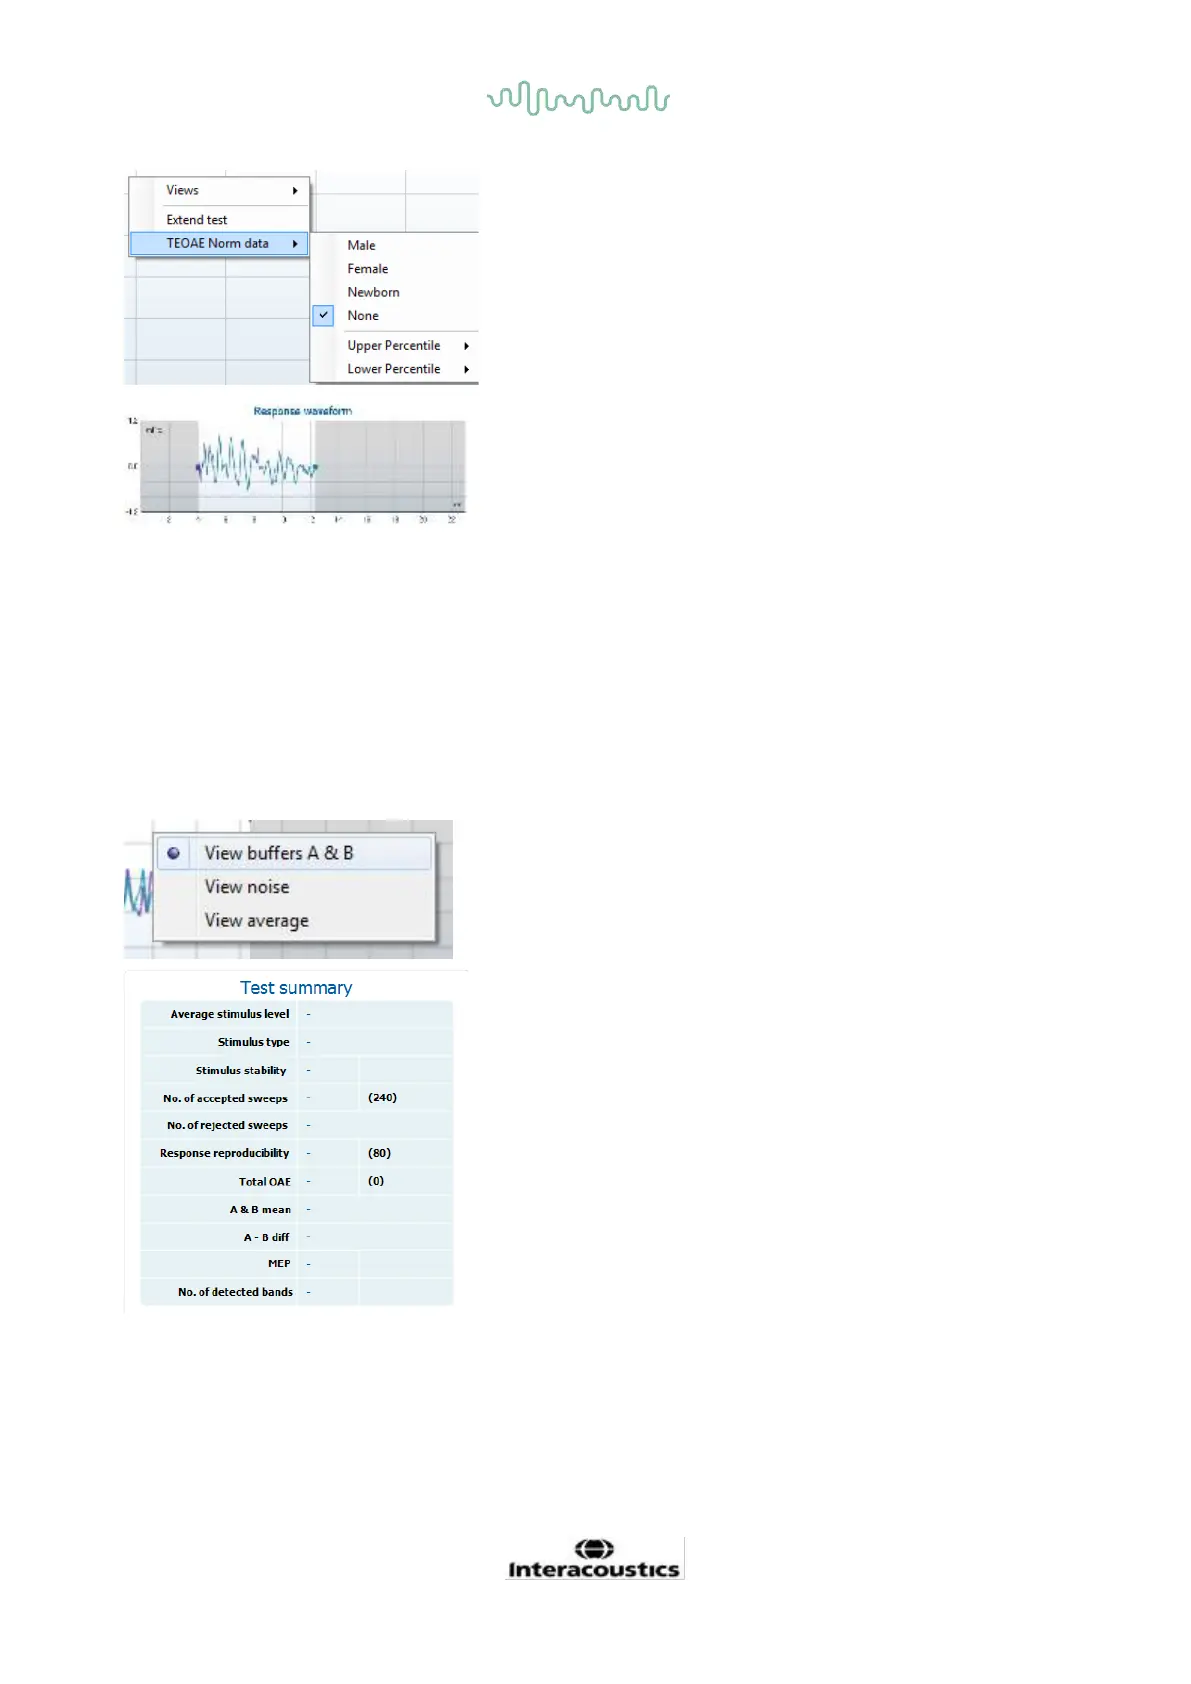
The response waveform along with the recording window and
response reproducibility range are shown.
The arrows indicate the recording window start and stop time.
The area outside the recording window is grayed out. The
recording window start and stop time can be changed prior to
starting a test by moving the arrows on the graph with the mouse,
The waveform reproducibility window range is indicated by a
black line on the x axis. Only the waveform within this range
accounts for the calculation of the waveform reproducibility
percentage.
Clicking on the aqua or purple circles at the end of each waveform
and moving the mouse, allows for separation of the curves within
the graph
Right clicking on the response waveform graph allows for
changing the display.
View buffers A & B is the default view showing the two
superimposed averaged OAE waveforms.
View noise displays the noise in the waveform (Noise = A buffer –
B buffer).
View average displays the mean of the A and B waveforms.
The minimum test requirements as defined in the protocol are
displayed beside some of the items in the Test summary table.
These numbers in parentheses change to a check mark when
the minimum requirement has been met during testing.