WWW.KAARTA.COM 44
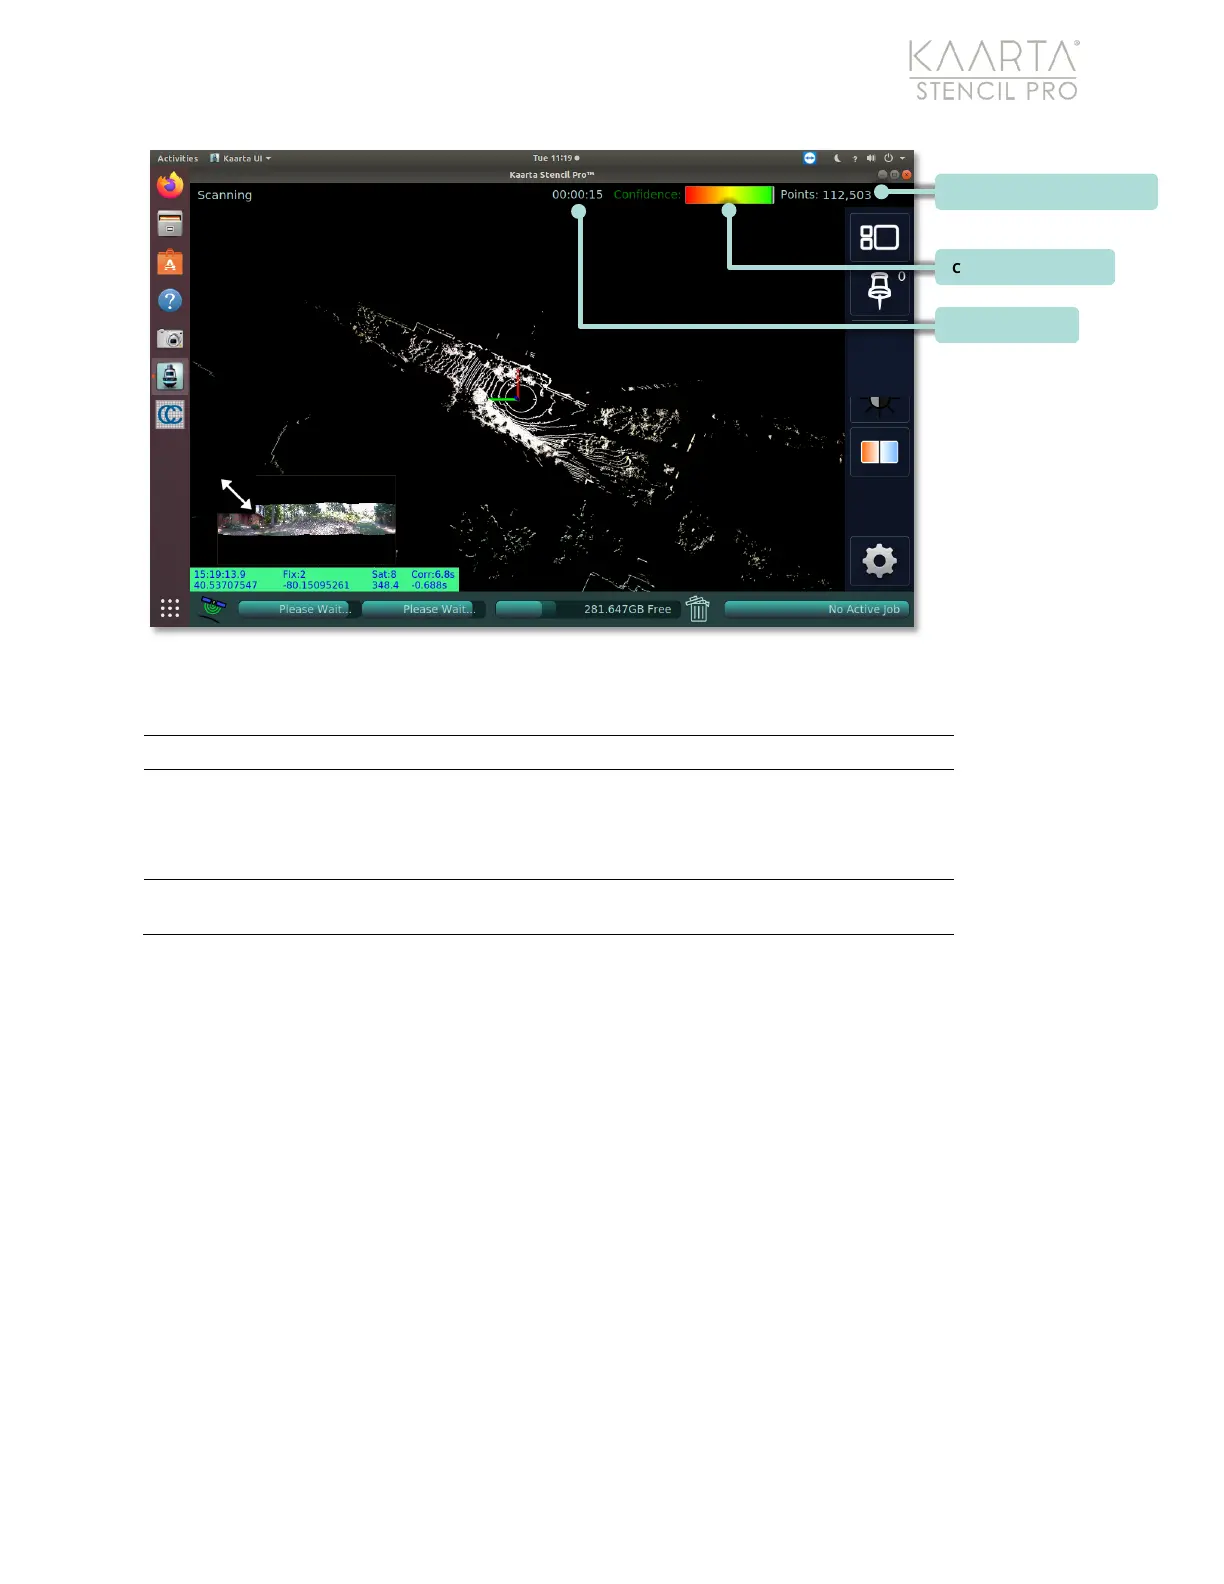
Figure 28: Scanning Status Bar elements labeled.
SCANNING STATUS BAR ELEMENTS
Time elapsed during current scan session.
Meter
The Confidence Meter displayed in the upper right provides a visual
indication of the quality of the map as it is being built. This is an
indication of how likely it is that the newest data is well matched to
The number of points collected during the current scan.
Confidence Meter
Notice the Confidence Meter in the upper right of the screen (see Figure 28). This is a
visual indication of how well the latest data was placed in the map. Green indicates good
confidence in the map building process. As the confidence level drops, it transitions to
yellow (warning), then orange, and finally red (low confidence). When the confidence
drops to orange, new data is no longer added to the map. This avoids the introduction of
significant errors to your map. However, your position continues to be updated.
To increase the confidence displayed, adjust your data collection techniques to increase
successful matching. Keep in mind that Confidence Meter is
not
a guarantee of good or
bad matches, but an indication of the statistical likelihood that the match was good.
Total Points Collected and Elapsed Time
These Total Points Collected and Scanning Time metrics calculate the current duration of
the scan and the total number of points collected (see Figure 28). With practice, these