3-5
SECTION 3
Bipolar Transistor Tests
vcebias
• represents the voltage bias value on the
collector-emitter of the transistor
If these values are left blank, the function will use the default
values given to the variables, but you can specify each variable
value by simply sending a number that is in-range in the func-
tion call. As an example, if you wanted to have the base voltage
swept from 0.1V to 1V in 10 steps, and the collector-emitter
voltage (V
CE
) to be biased 5V, you would send
G u m m e l(0.1,
1, 10, 5)
to the instrument.
The base-emitter voltage will be swept between 0V and 0.7V in 10.
0.01V increments, and both I
B
and I
C
will be measured at each
V
BE
value. Note that a fixed collector-emitter voltage of 10V is
used for the tests.
Once the sweep has been completed, the data (I11.
B
, I
C
, and V
BE
)
will be presented in the Instrument Console window of TSB.
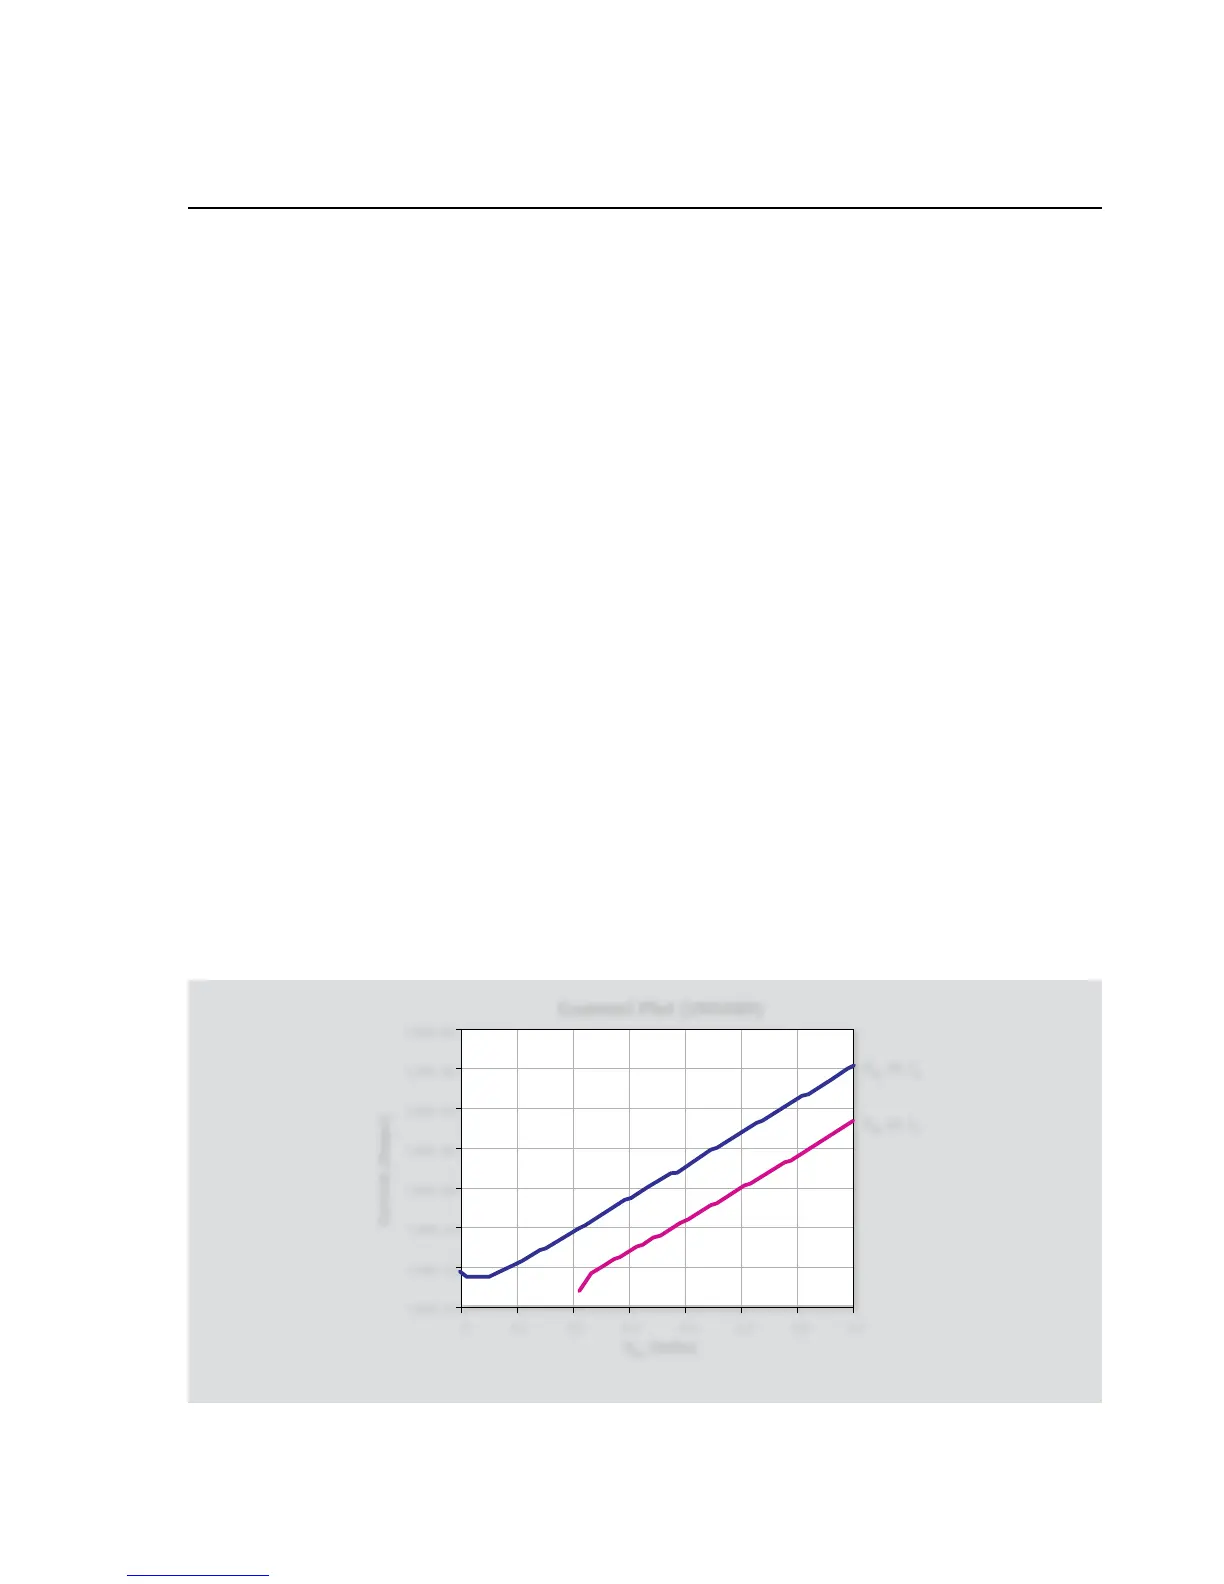
3.4.4 Typical Program 5 Results
Figure 3-4 displays a typical Gummel plot as generated by
Example Program 5. Again, the transistor used for this example
was a 2N5089 NPN silicon transistor.
3.4.5 Program 5 Description
SMUB, which sweeps V
BE
and measures I
B
, is set up as follows:
Source V•
1mA compliance, autorange measure•
Local sensing•
1 NPLC Line cycle integration•
vbestart
• : 0V
vbestop
• : 0.7V
vbesteps
• : 70
SMUA, which sources V
CE
and measures I
C
, is programmed in the
following manner:
Source V•
Local sensing•
100mA compliance, autorange measure•
1 NPLC Line cycle integration•
Constant sweep (number of points programmed to 71), •
V
CE
= 10V
vcebias
• : 10V
Following unit setup, both unit triggers are armed, and the instru-
ments are placed into the operate mode (lines 320 and 330).
Once triggered, SMUB sets V
BE
to the required value, and SMUA
then sets V
CE
and measures I
C
at I
B
. At the end of its measurement,
SMUB increments V
BE
and the cycle repeats until V
BE
reaches the
value set for
vbestop
.
During the test, V
BE
, I
B
, and I
C
are measured. Once the test has
completed, the data is written to the Instrument Console of TSB
and can be graphed in a spreadsheet program using the “copy-
and-paste” method of data transfer.
 Loading...