4 -3
SECTION 4
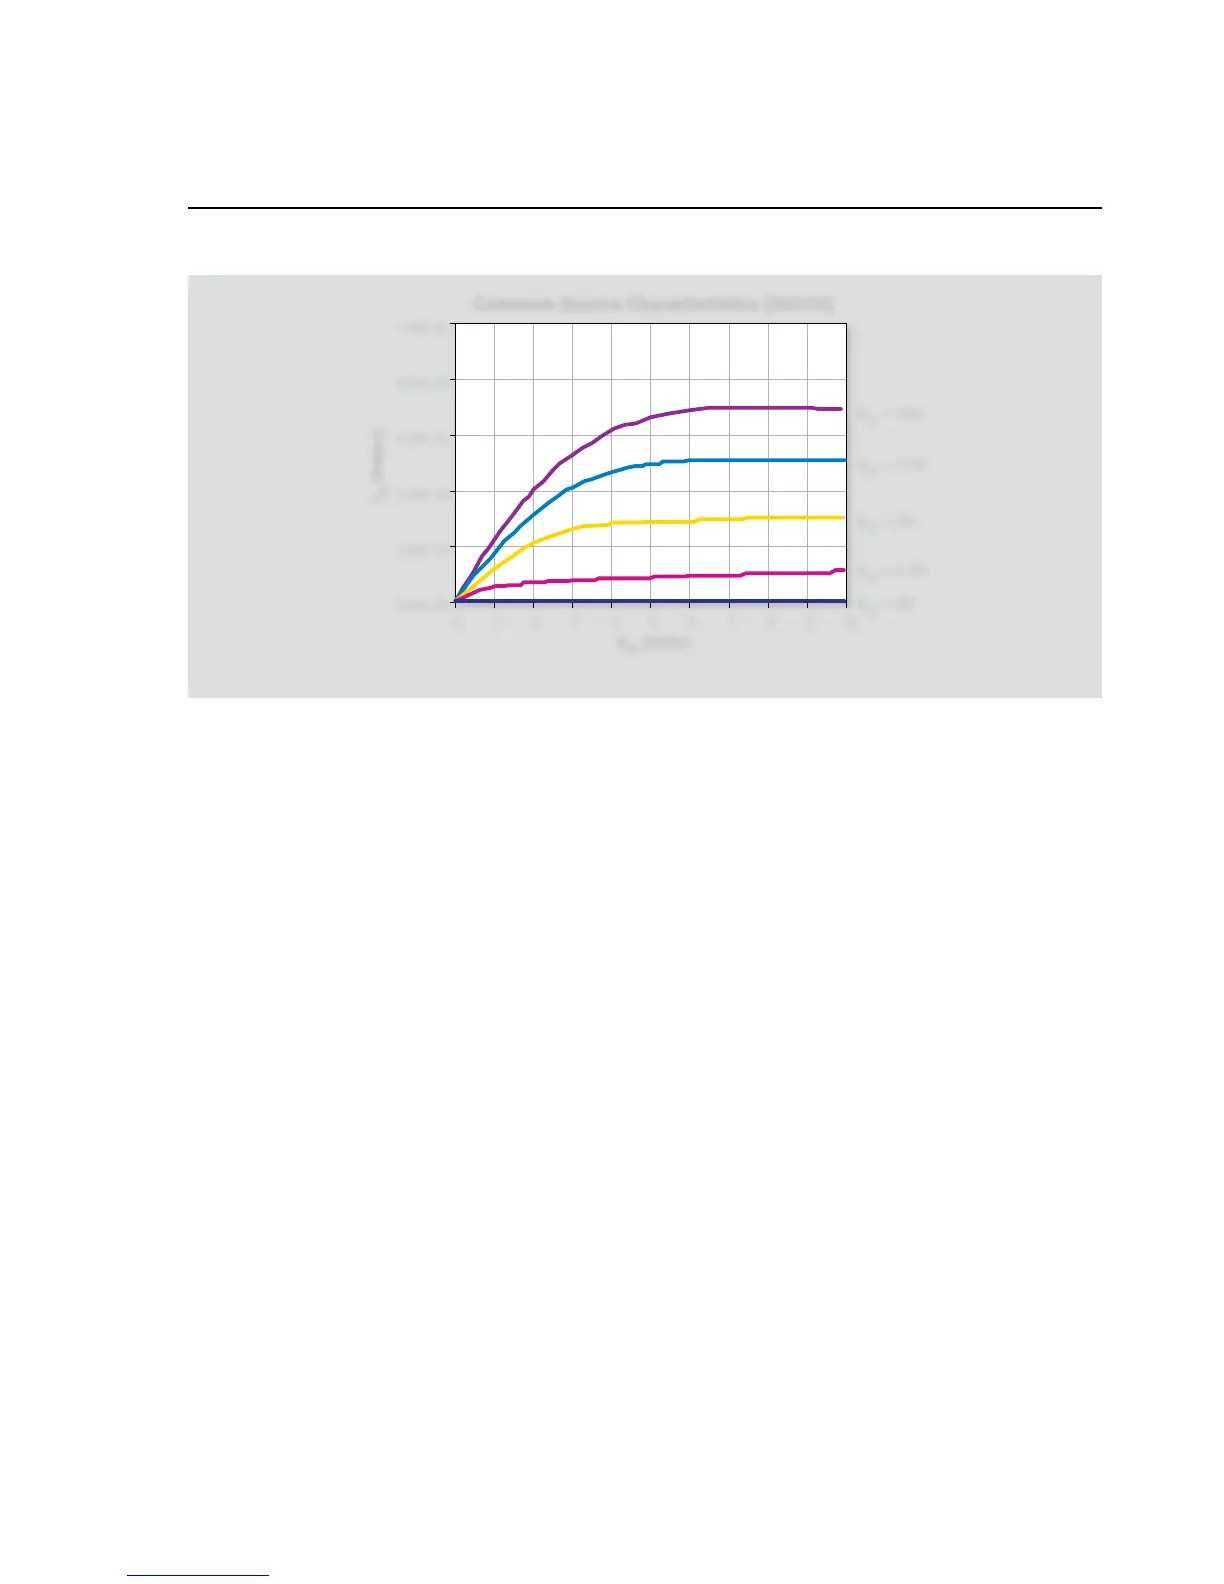
FET Tests
Source V•
Local sensing•
100mA compliance, autorange measure•
vdsstart
• : 0V
vdsstop
• : 10V
vdssteps
• : 100
1 NPLC Line cycle integration•
Following setup of both units, the outputs are zeroed and
enabled. The first gate-source bias (V
GS
) source value is applied
and the drain-source voltage (V
DS
) sweep is started. At each point
in the V
DS
sweep, the drain current (I
D
) is measured. When the
final V
DS
value is reached, the drain-source voltage is returned
to 0V, the gate-source voltage (V
GS
) is incremented, and the V
DS
sweep begins again.
Upon reaching the final V
DS
value, the outputs are zeroed, dis-
abled, and the data (V
GS
, V
DS
, and I
D
) is printed to the Instrument
Console Window of TSB, where it can be copied and pasted to a
spreadsheet for graphing.
4.3.5 Modifying Program 9
For other V
GS
values, simply modify the
vgsstart
,
vgsstop
,
and
vgssteps
variables as required.
Similarly, V
DS
can be swept over a different range by changing the
vdsstart, vdsstop, and vdsstep variables to the desired values.
4.4 Transconductance Tests
The forward transconductance (g
fs
) of an FET is usually meas-
ured at a specific frequency (for example, 1kHz). Such a test can
be simulated with DC values by using as small an incremental
change in DC parameters as possible. For example, assume that
we source two gate-source voltages, V
GS1
and V
GS2
, and measure
two resulting drain currents, I
D1
and I
D2
. The forward transcon-
ductance can then be approximated as follows:
∆
ID
g
fs
=
____
∆V
GS
where: g
fs
= forward transconductance (S)
∆
ID
= I
D2
– I
D1
∆V
GS
= V
GS2
– V
GS1
Two common plots involving g
fs
include g
fs
vs. V
GS
and g
fs
vs. I
D
.
The programming examples included in this section demonstrate
how to generate g
fs
vs. V
GS
and g
fs
vs. I
D
plots.
4.4.1 Test Configuration
Figure 4-3 shows the general test configuration for transconduc-
tance tests. SMUB sweeps V
GS
, while SMUA sources V
DS
and also
measures I
D
. g
fs
values are computed from incremental changes in
I
D
and V
DS
. Note that an N-channel FET such as a SD210 is recom-
mended for use with the example programs that follow.
 Loading...