Specifications and Application Information Appendix A
Series E4360 User’s Guide 91
Peak Power Tracker Application
The peak power tracker is a customer-provided application. In this
application, the load is constantly searching for the maximum power
point of the I-V curve. To achieve this, the peak power tracker sweeps
around the peak power point. The SAS can be used in this application in
either SAS mode or in Table mode. Note that the ability of the SAS to
track the I-V curve depends on both the excursion from the peak power
point and the modulation frequency.
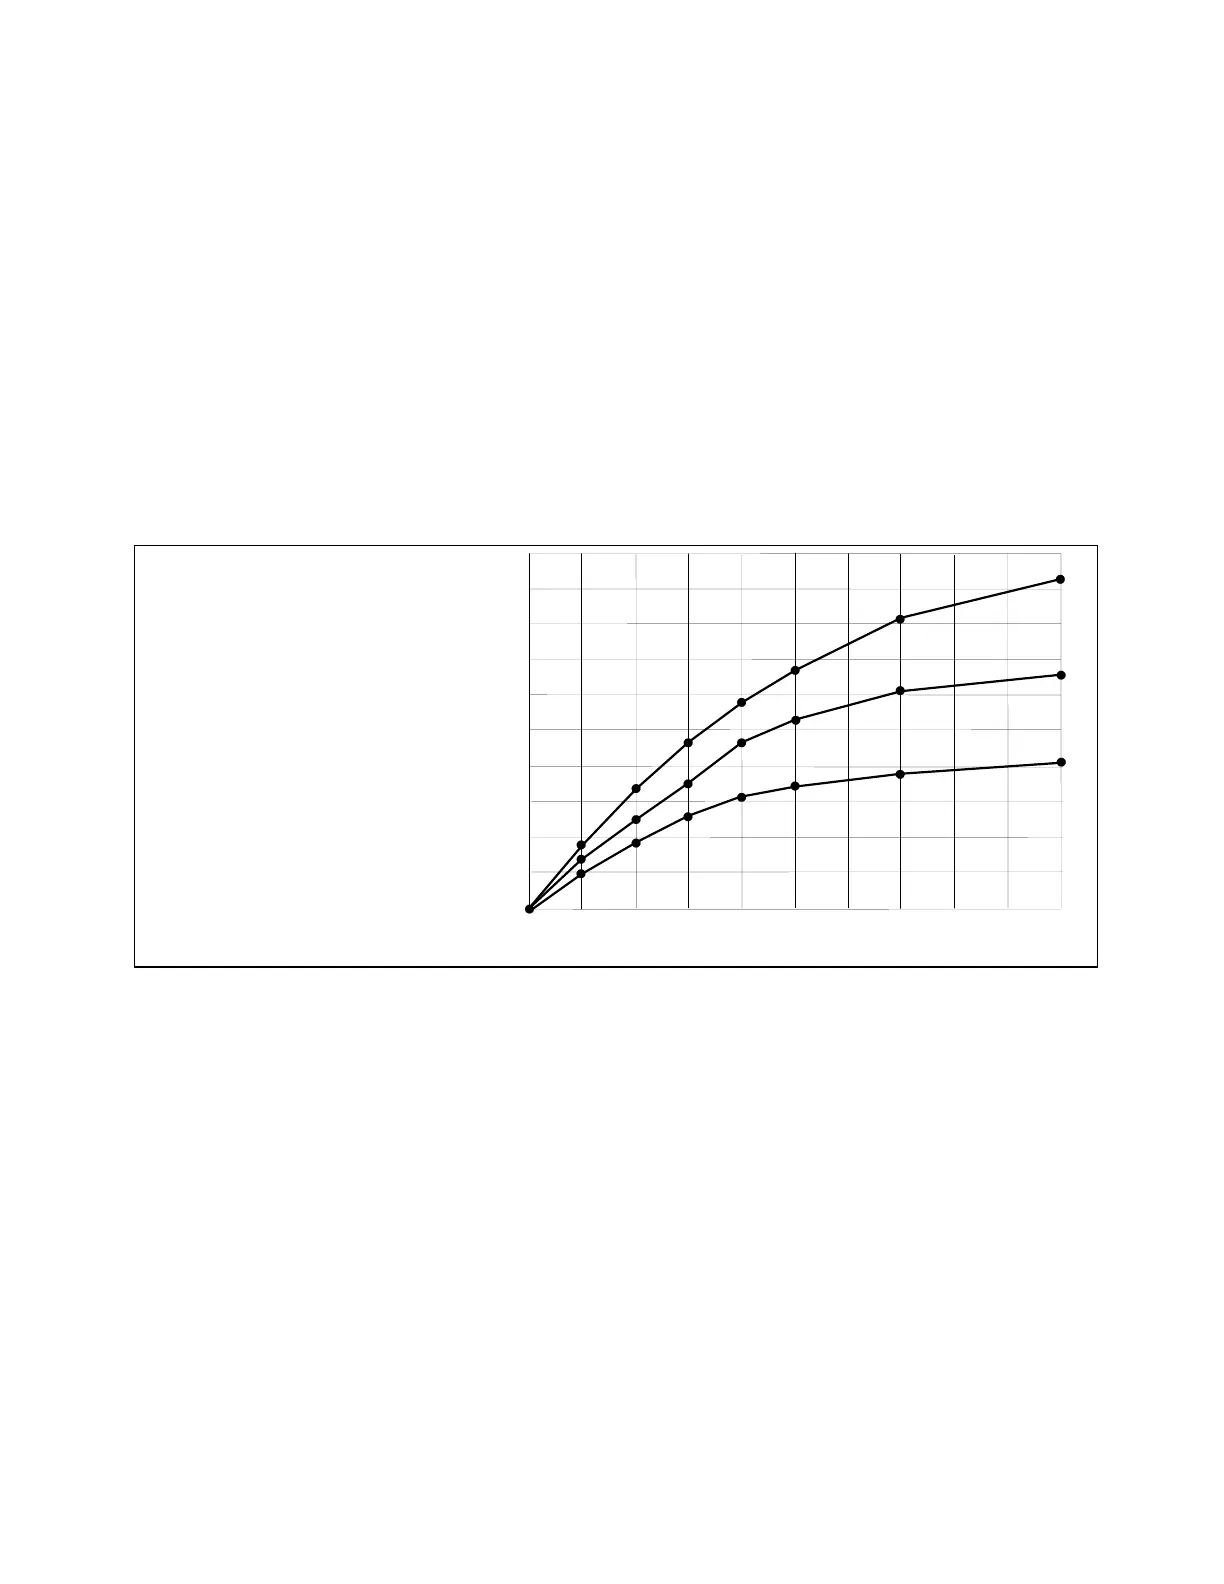
The following graph depicts the SAS peak power tracking error for both
models. The load is sinusoidally swept from -5%, -10%, or -15% on one
side of Pmp to -5%, -10% or -15% on the other side of Pmp. As the
frequency of the sweep is increased, the tracking error will increase as
indicated by the graph
Voc
Vmp
Imp
Isc
Pmp
65V
60V
7.5A
8A
450W
130V
120V
3.75
4A
450W
0 100 200 300 400 500 600 700 800 900 1000
-5
-3
-1
0
-2
-4
-6
-7
-8
-9
-10
V-
I Sweep Frequency
in Hertz
Power Error
As a Percent
of Pmp
At - 15% of Peak Power
At - 10% of Peak Power
At - 5% of Peak Power
Figure A- 1. Percent Power Error in SAS Mode
 Loading...