Vers. 111422 28
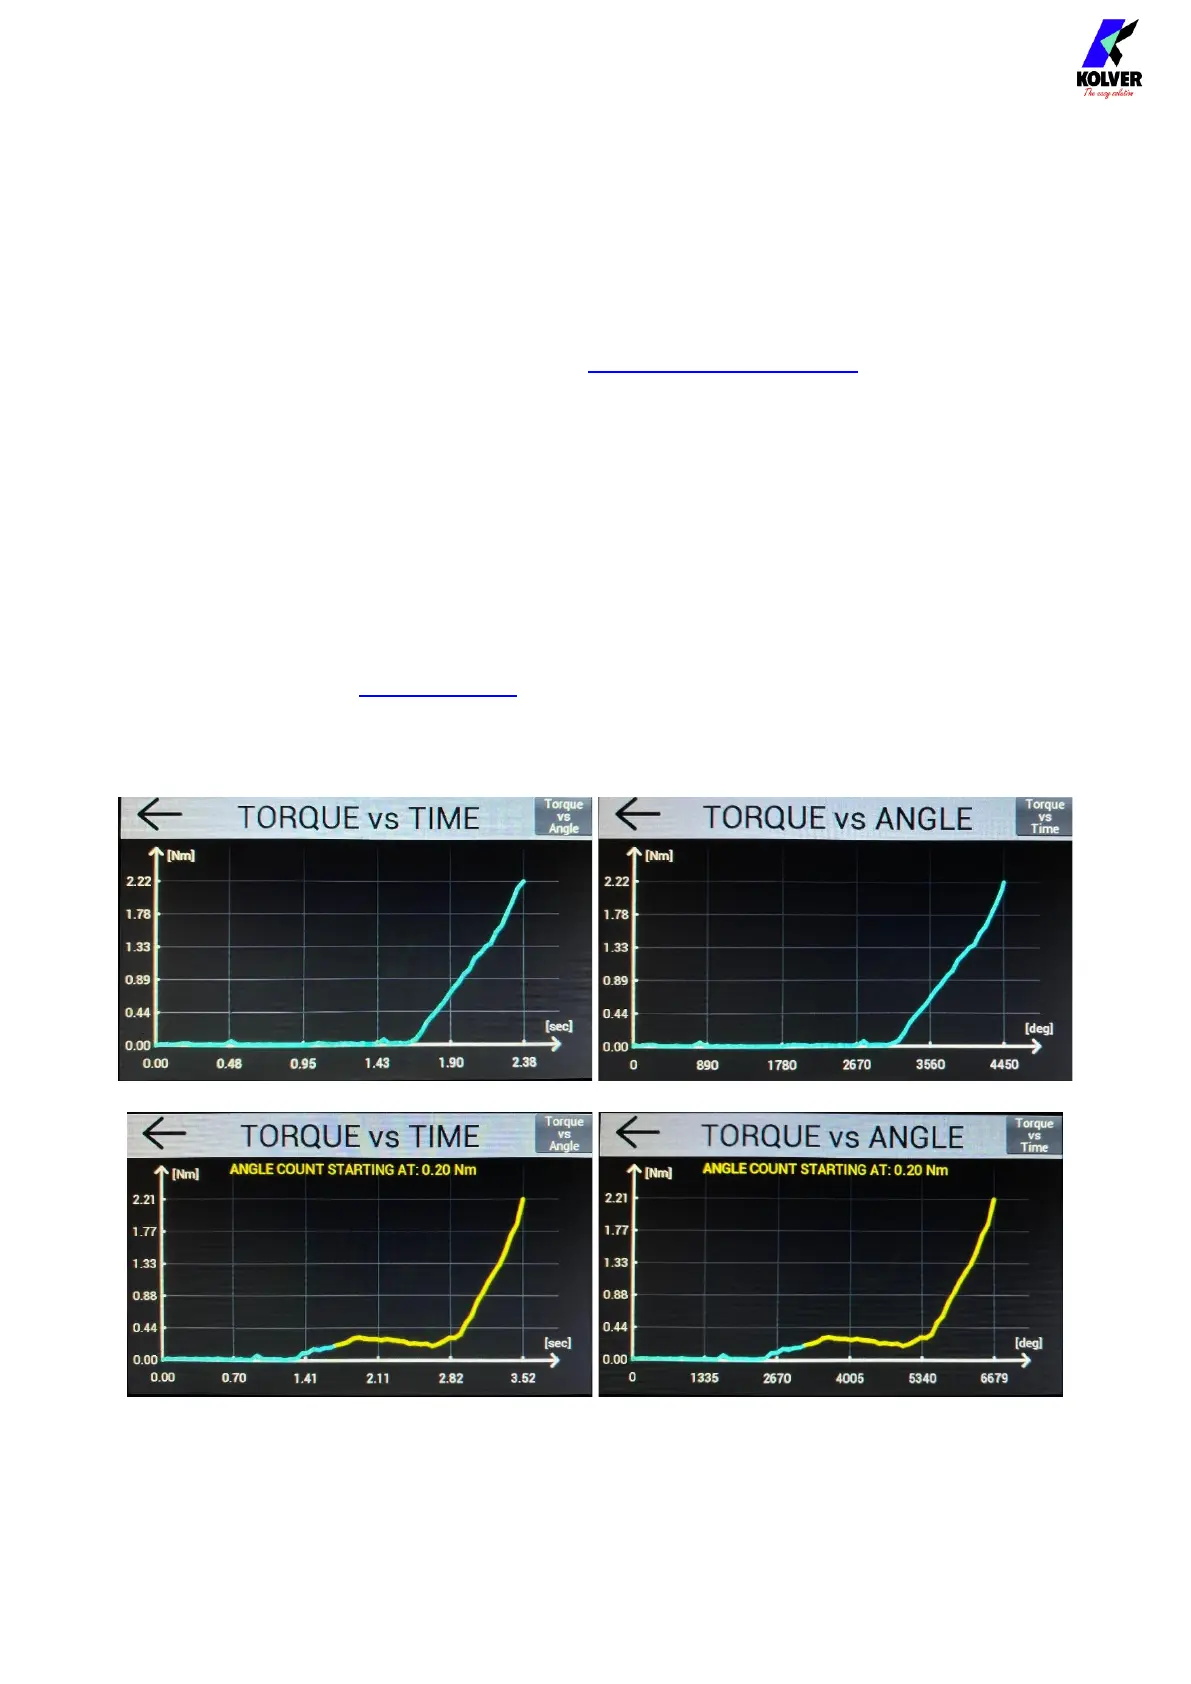
Interpreting the Torque and Angle charts
The “Torque vs Time” graph shows the torque measured by the screwdriver starting from
the moment the lever is pressed (or a remote-lever command is received) up to the moment
the tightening finishes correctly in an error condition (such as “Torque Over Max”).
The Y-Axis represents the torque data, in the MEASUREMENT UNITS selected.
The X-Axis represents the time, in seconds, or, in the case of the Torque vs Angle chart, the
angle of revolution, in degrees, always starting from the moment that that the lever is
pressed and ending at the moment the tightening finished.
The maximum Y-Axis tick shown on the Y-Axis always corresponds to the maximum
torque measured during the tightening. In those situations where the maximum torque is
not equal to the final torque, the final torque value will be annotated next to the final point
of the torque graph.
When the Angle Count STARTING AT setting is set to “Ext” or to a non-zero Torque
Threshold, the torque graph will change color and the torque value at which the angle
count was triggered will be displayed on the screen.
The graphs illustrated here were produced with a KDS-PL6/ESD screwdriver running on
Kolver joint simulator (part number 240600) arranged in the semi-elastic configuration. We
supplied additional hand-resistance to generate the “starting at” threshold.
 Loading...