13
Chapter 3: PerformanceAmpliFi User Guide
ULabs
Chapter 3: Performance
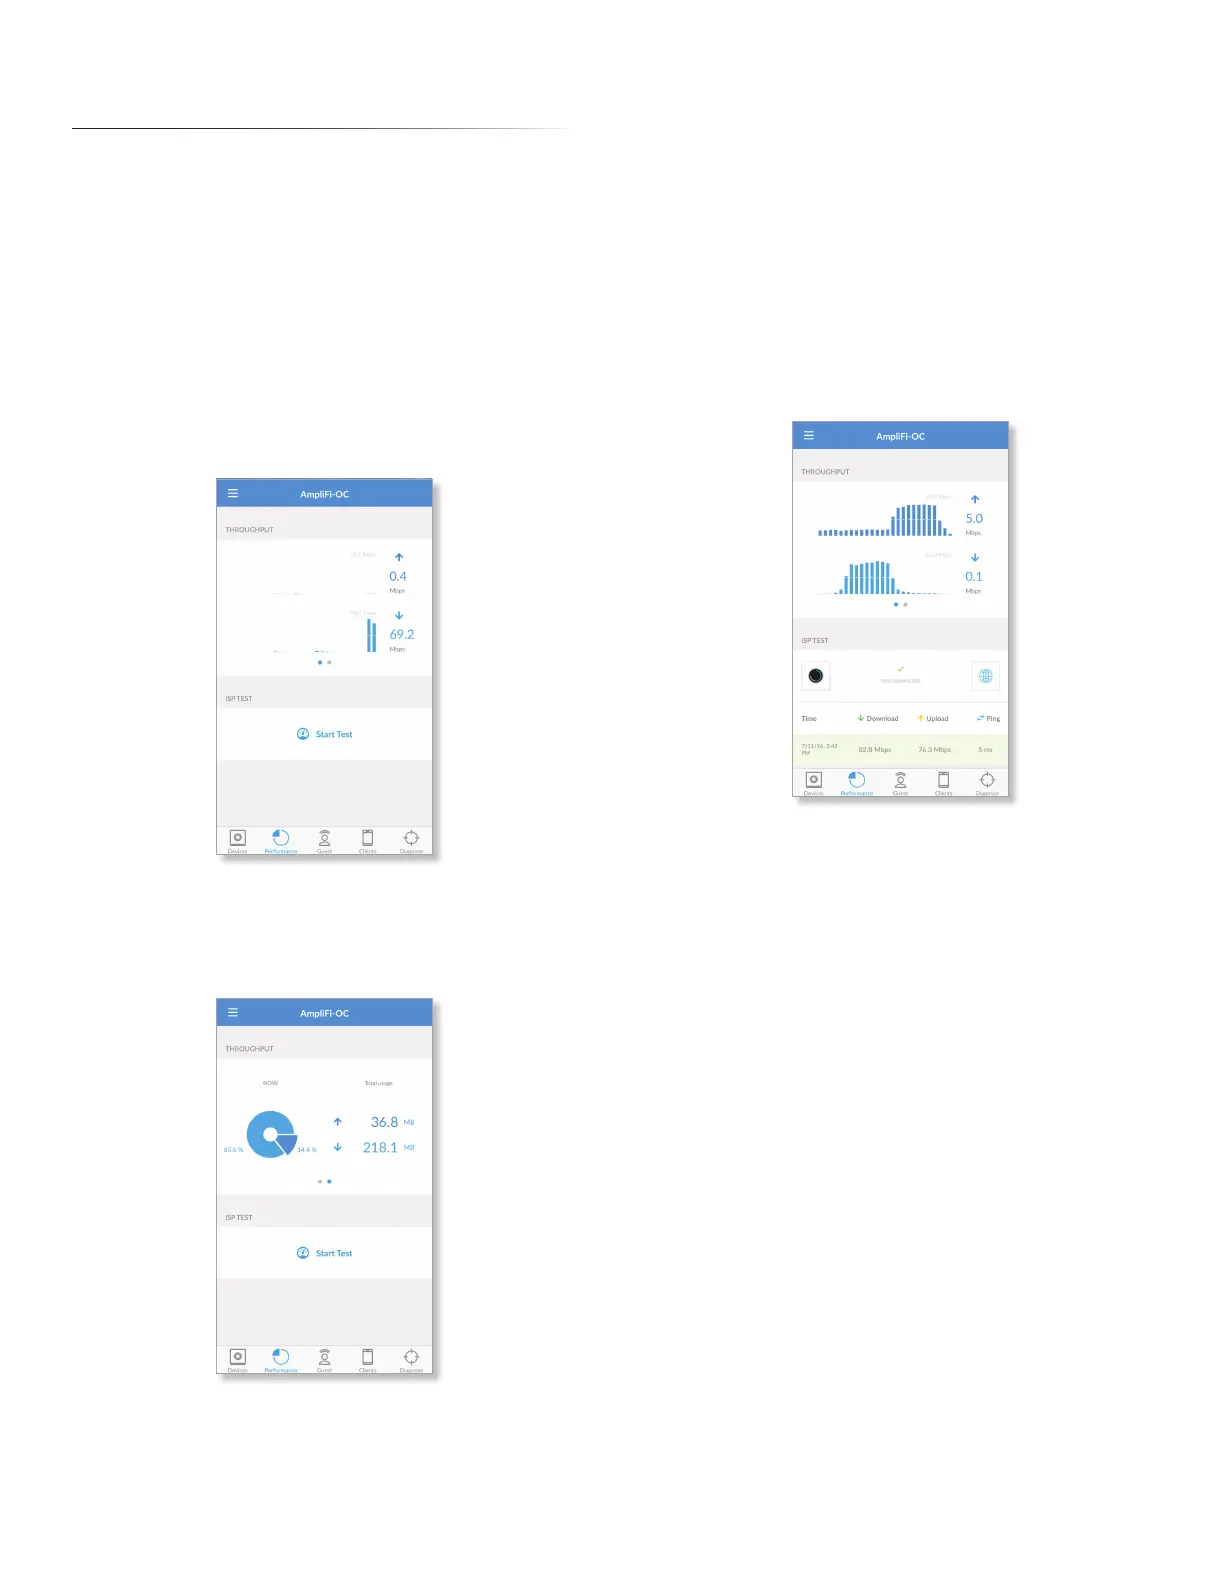
The Performance screen allows you to access the throughput
statistics and run a speed test. You can examine up-to-date,
second-by-second performance so you know how the
Router and Mesh Points are communicating with your
devices. Having access to the Router’s data is useful if your
network has issues or if you make changes to your network.
Throughput
The initial view displays the Throughput graph. It shows a
recent history of upload and download throughput. The
maximum upload and download values are labeled in the
graph, and the current upload and download values are
displayed on the right.
Swipe to the right to display the Throughput pie chart. It
shows the percentages of current download and upload
data usage. The Total Usage column displays the total
amount of data uploaded and downloaded.
ISP Test
You can run a speed test that will provide your download
speed, upload speed, and connection ping time. A history of
recent tests is displayed at the bottom.
Tap Start Test to run the speed test. When the test is
complete, the following results will be displayed:
Time Displays the date and time of the speed test.
Download Displays the download speed.
Upload Displays the upload speed.
Ping Displays the duration of the average Ping round-trip
time.