112 /
The histogram
The histogram
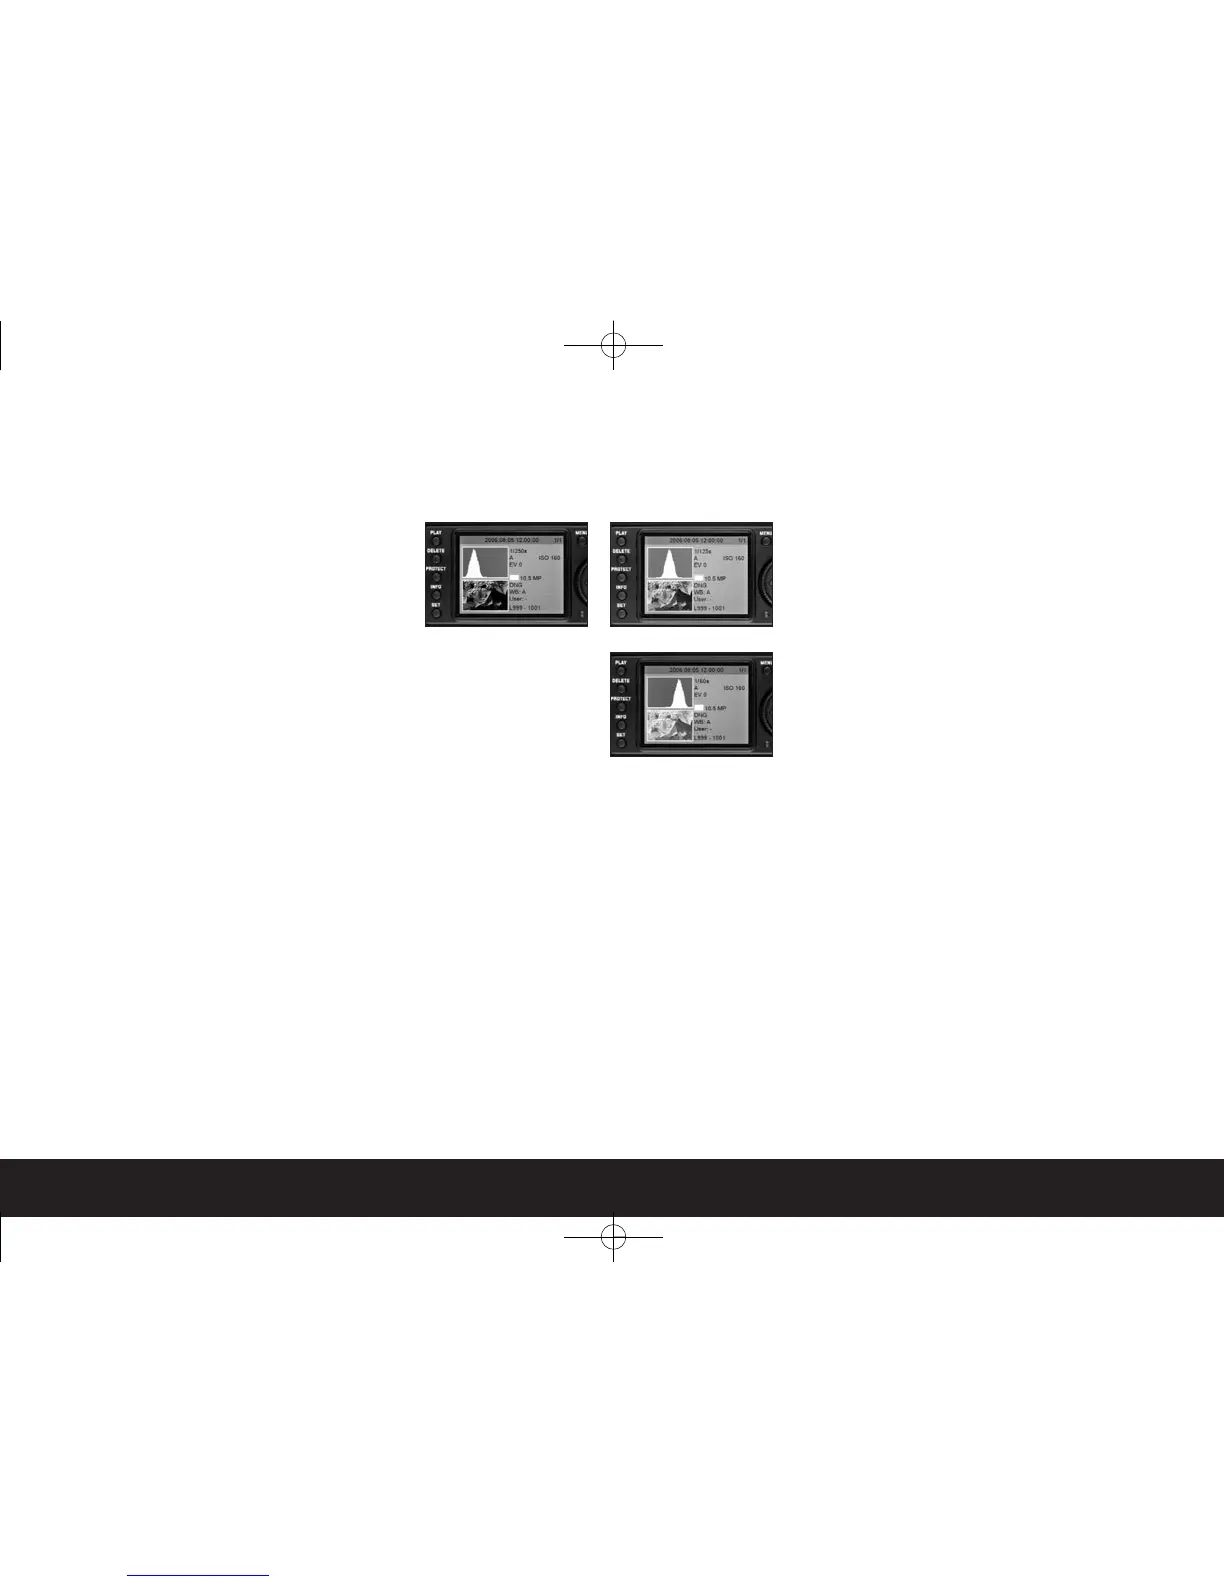
The histogram (4.2.2) depicts the brightness distribu-
tion in the picture. The horizontal axis shows the tone
values from black (left) through grey to white (right).
The vertical axis depicts the number of pixels of each
brightness level. This form of presentation – together
with the impressing of the picture itself – permits an
additional quick and easy assessment of the exposure
setting after taking the picture.
The LEICA M8.
2 allows you to choose between four
versions of the histogram: Based on either the overall
brightness or separately for the three primary colors
red/green/blue, optionally with or without identifica-
tion (red) of the areas in the picture where no image
appears because they are too bright (clipping).
Note:
The histogram display always refers to the section of
the picture displayed at that time.
Setting the function
1. In the main menu (see p. 94/113), select
Histogram (5.1.9) and
2. in the associated sub-menu select the desired func-
tion: (Std. w/o Clipping, Std. with Clipping, RGB
w/o. Clipping, RGB with Clipping).
Note:
The histogram is not available when simultaneously
viewing several reduced pictures (see p. 141).
A: Predominance of dark
pixels, only few bright
ones: Underexposure
B: Most pixels are of medium
brightness: correct expo-
sure
C: Predominance of bright
pixels, only few dark ones:
overexposed
AB
C


 To Next Page