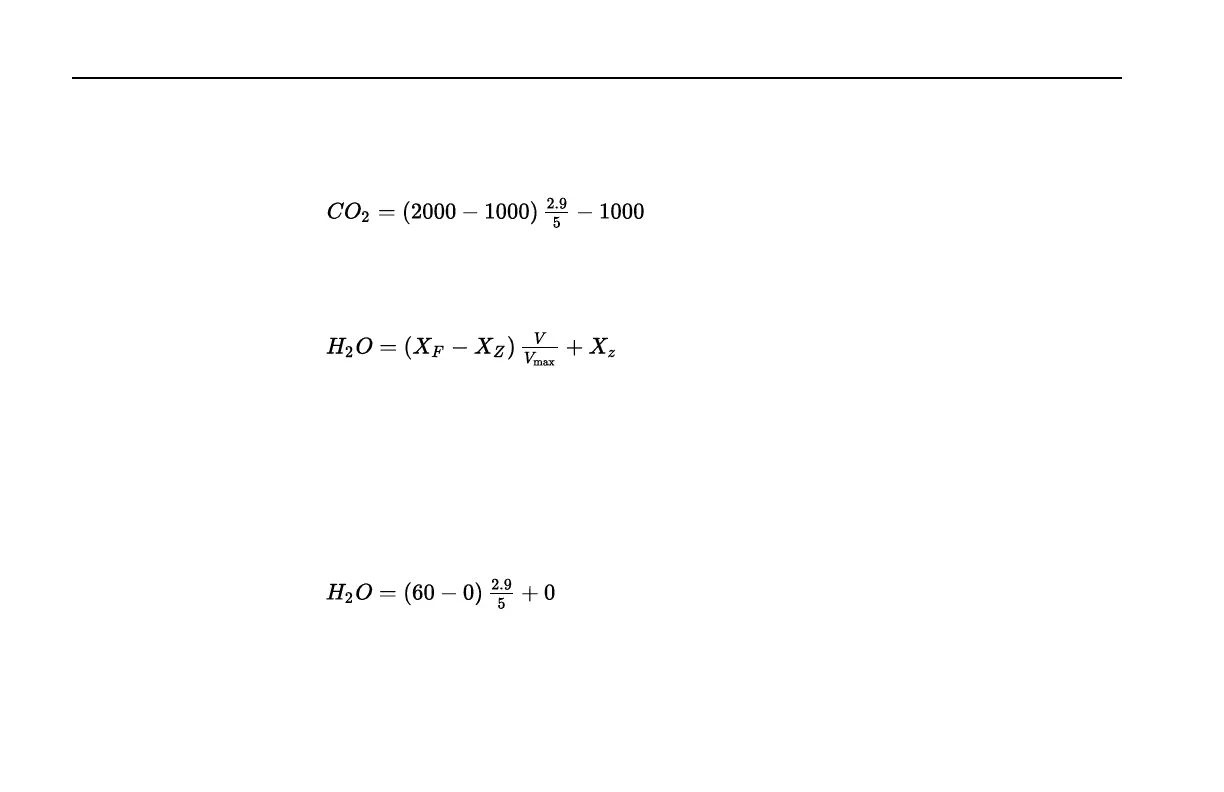
Example: The DAC output range selected is 0-5V (V
max
), the zero CO
2
value entered is 1000
ppm (X
Z
), the full scale CO
2
value entered is 2000 ppm (X
F
), and the measured output voltage
(V) is 2.9V. To calculate the CO
2
concentration from 3-1 above,
3-3
= 1580 ppm.
The H
2
O concentration (mmol/mol) can be calculated from the DAC output voltage as follows:
3-4
where V is the measured voltage, X
F
is the full scale value for H
2
O output (entered in the Set-
tings Window as the 2.5 or 5V value, up to 60 parts per thousand), X
Z
is the zero value entered,
and V
max
is the full scale DAC output voltage selected (5V or 2.5V).
Example: The DAC output range selected is 0-5V (V
max
), the zero H
2
O value entered is 0 ppm
(X
Z
), the full scale H
2
O value entered is 60 mmol/mol (X
F
), and the measured output voltage
(V) is 2.9V. To calculate the H
2
O concentration from equation 3-4 above,
3-5
= 34.8 mmol/mol.
Section 3
3-10 Section 3. Operation
 Loading...