23. DESCRIPTION OF DOLBY PROCESSING CHART
This chart shows the condition of the signals available at the speakers (SPKRS) and at the
TAPE MONITOR OUT terminals as a function of different control settings.
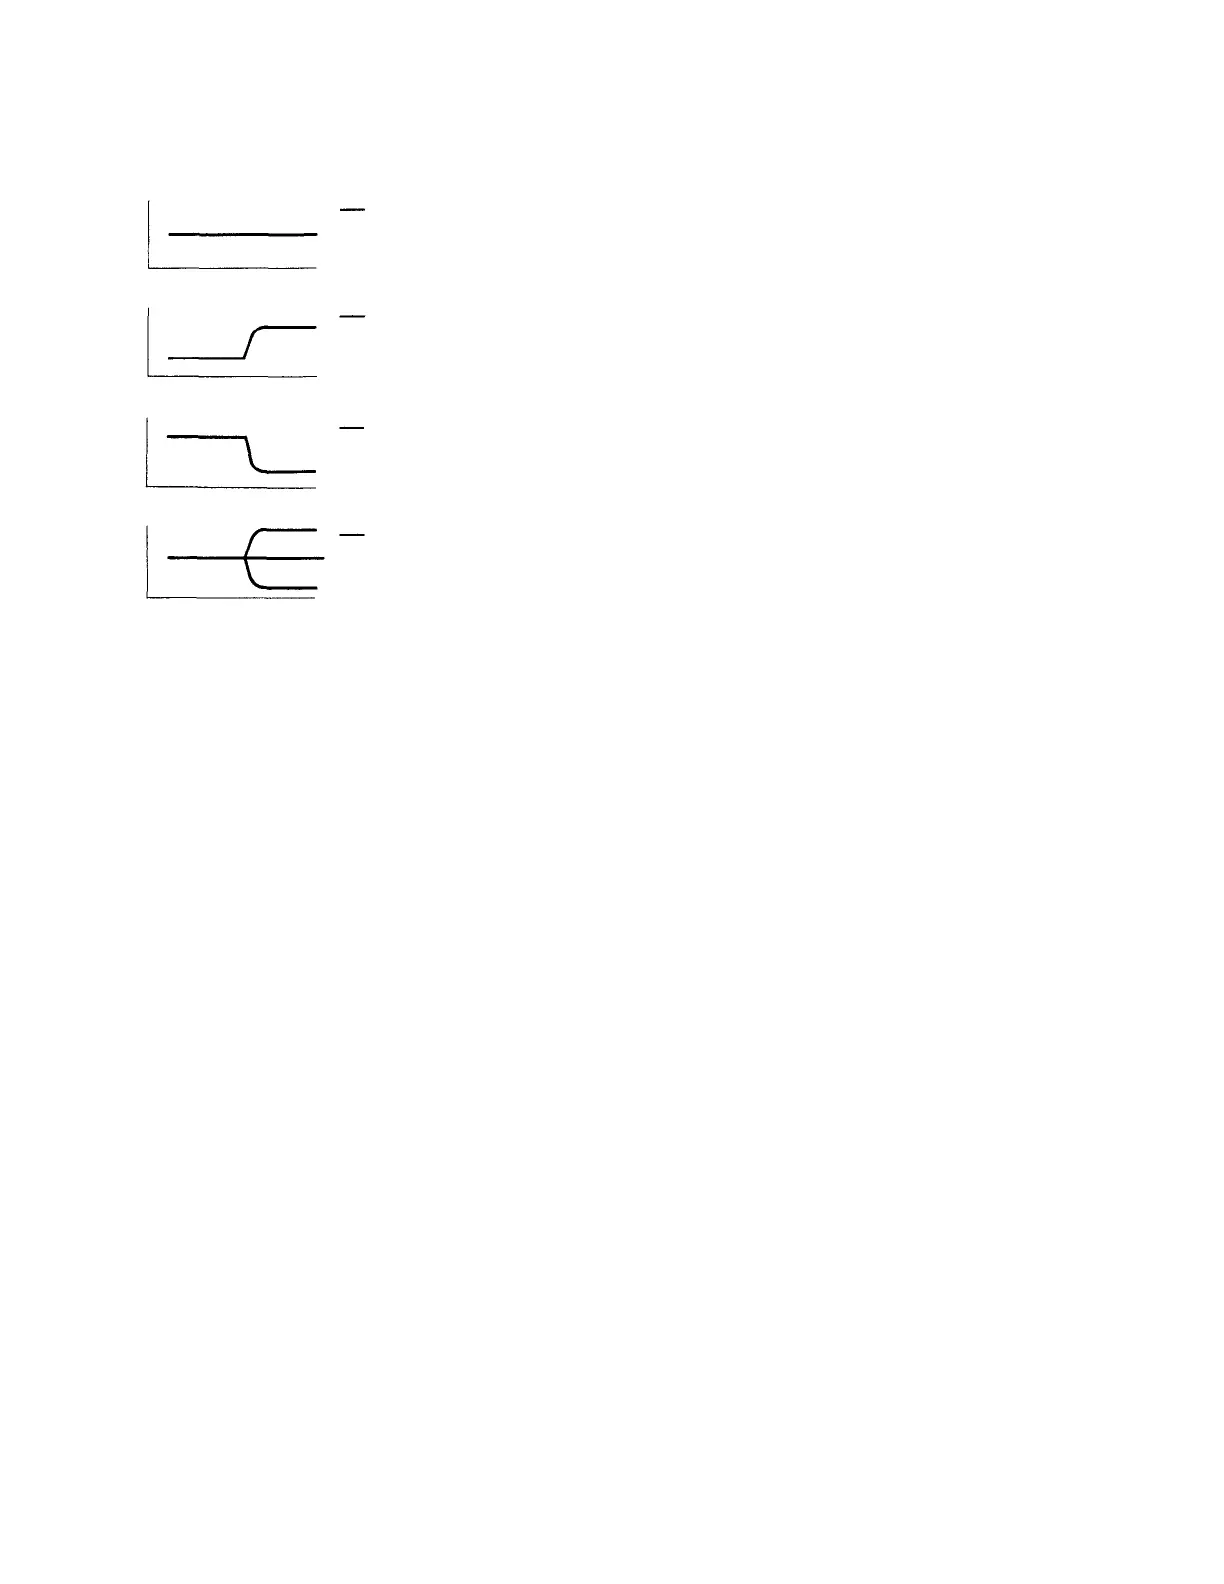
To understand the chart refer to the symbols below:
Represents a signal which has not been applied to either Record or
Playback Dolby circuits. The relative amplitudes at all audio frequencies
remain unaltered at all levels.
Represents a signal which has been processed by the Dolby Record
circuit. The relative amplitudes at high frequencies are increased at low
signal levels.
Represents a signal which has been processed by the Dolby Playback
circuit. The relative amplitudes at the high frequencies are decreased at low
signal levels.
Represents a signal which has been processed by both the Record and
the Playback Dolby circuits.
The Dolby Record and Playback circuits are complementary.
Therefore, relative amplitudes at all audio frequencies are restored to their original levels.
13
www.freeservicemanuals.info
Digitized in Heiloo Netherland