A note on coverage nulls
It is useful to be able to calculate where these first response nulls will occur for
various frequencies as they indicate areas where coverage, transient response and
directional information would be poor without fill systems. For symmetrical arrays
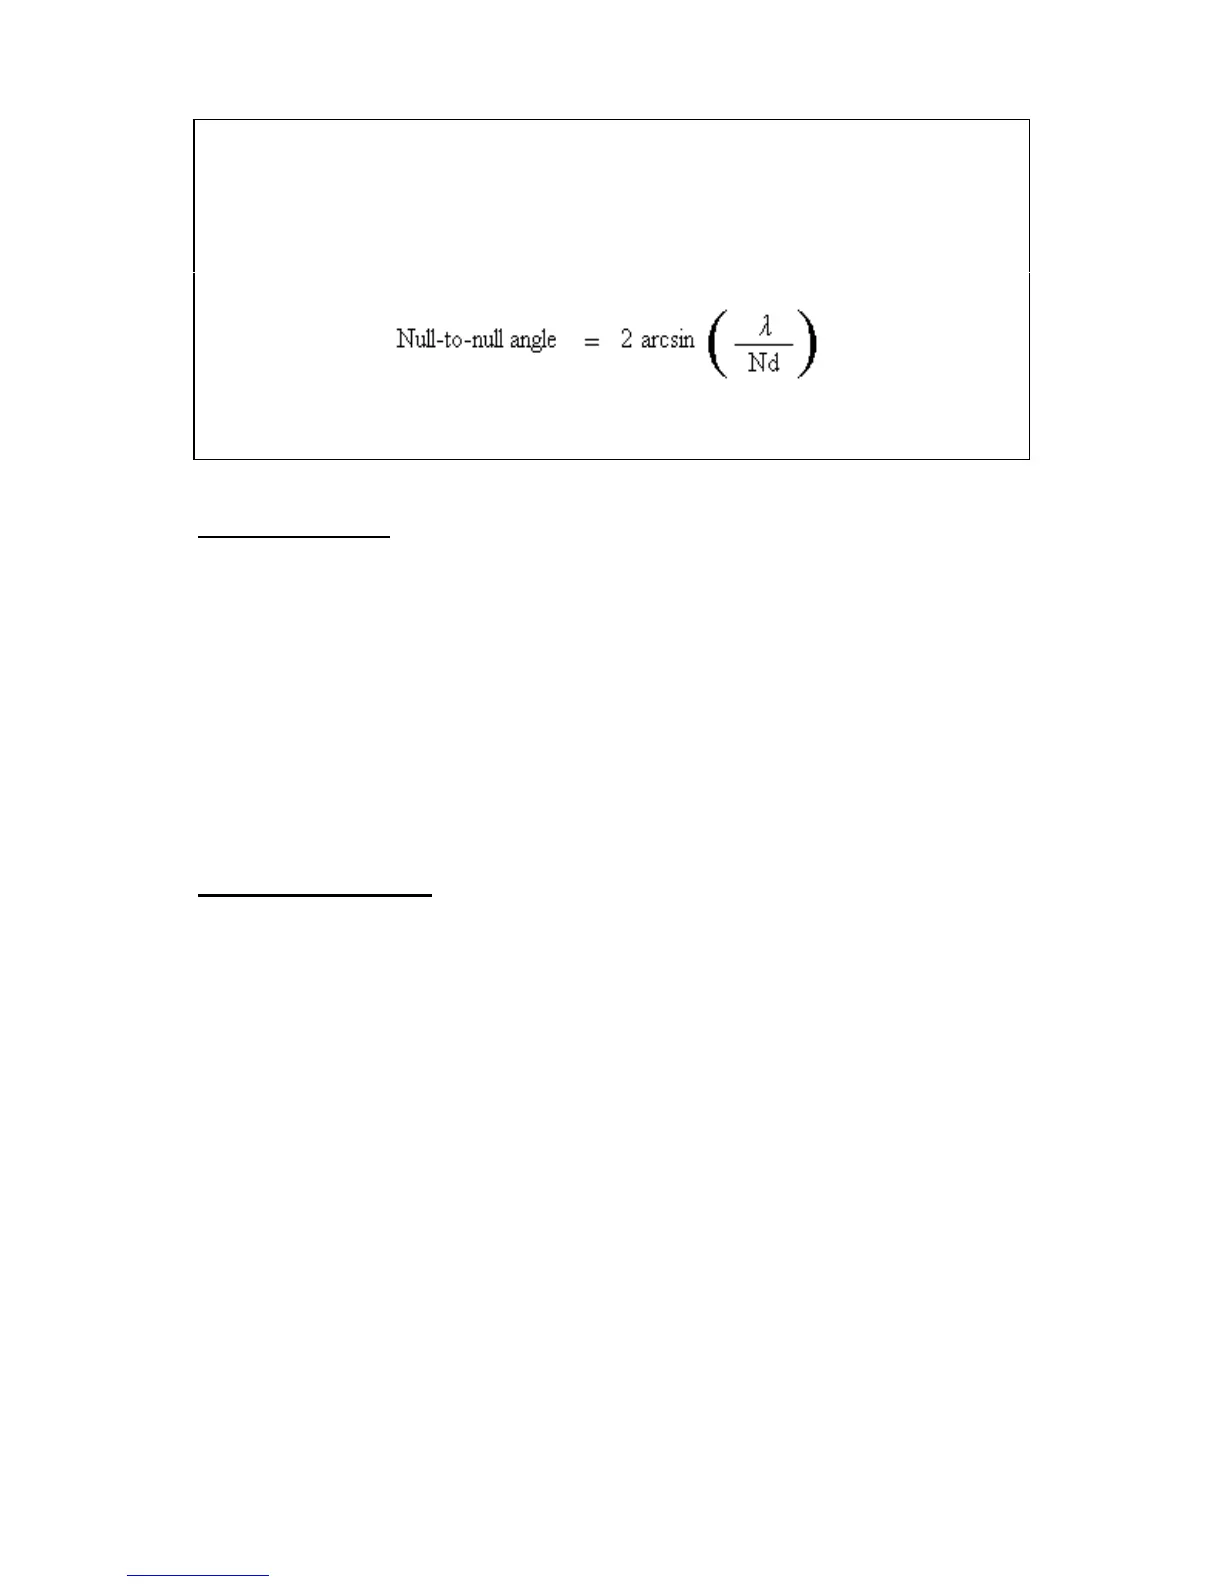
nulls will occur either side of the on-axis line. We can calculate the overall “null-to-
null” angle using the simple formula:
As a very rough guide, the null-to-null angle will be approximately twice the -6dB
coverage angle.
Interpreting polar plots
i) It is conventional to “normalise” polar plot on-axis amplitudes so that different polar shapes may be
readily compared. In practice, the large array (right example) would have a higher on-axis amplitude
than the medium array.
ii) It is also conventional to plot polar amplitudes on a logarithmic scale. This is fine when working in
sound pressure level terms but is not suitable for superimposing a polar plot onto a venue plan. Venue
plans are drawn to a linear scale so polar plots with linear amplitude scales would be more suitable.
iii) Polar plots have been simplified in this article for clarity. Real-world off-axis lobe amplitudes and
shapes would vary considerably depending on boundary loading, echoes, reverberation and other
audio sources affecting the same space.
Vertical -6dB coverage
The following table gives the approximate vertical coverage angles of typical WSX
arrays - ignoring boundary effects (see later).
WSXs High Vertical coverage
(on sides) 40Hz 80Hz 160Hz
3 Wide Wide 98º
4 Wide Wide 69º
8 Wide 69º 33º
16 69º 33º 16º
♦ Use tall stacks for long shots. Useful for long distances in low-roofed venues
with raked seating up to the height of the stack
♦ Use short stacks for short, wide vertical shots
♦ Use tall, electronically steered, stacks to project to high, distant seating - see
Section 4.11
All material © 2007. Martin Audio Ltd. Subject to change without notice.