37
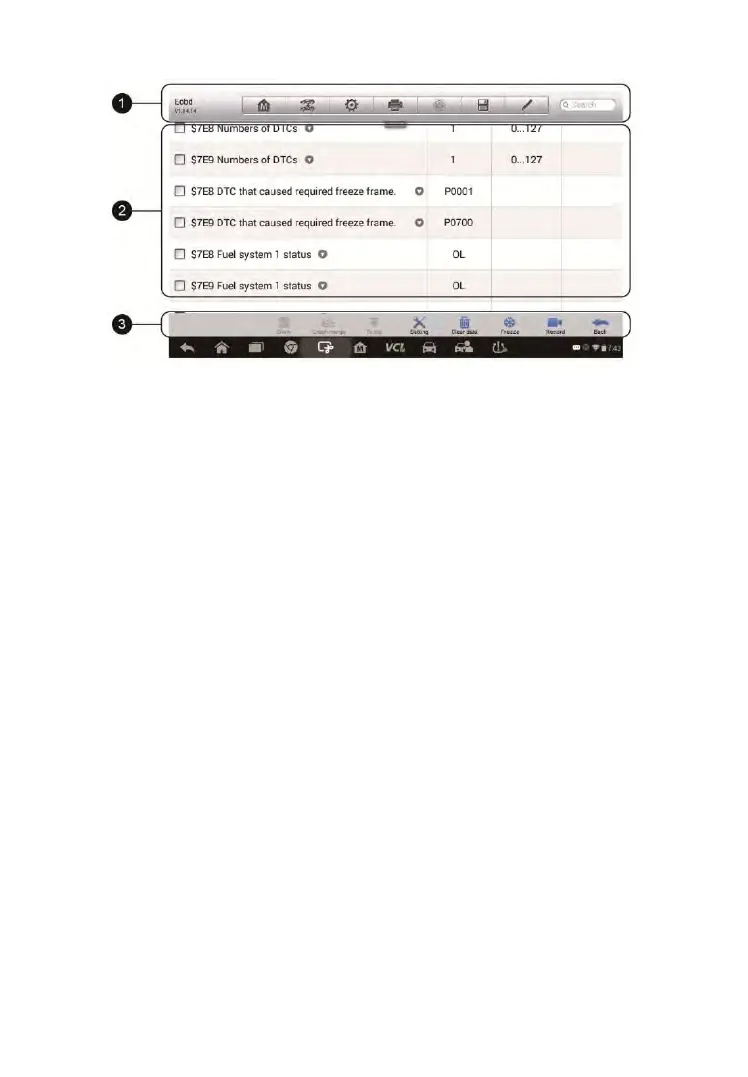
Figure 4-13 Sample Live Data Screen
1. Diagnostics Toolbar Buttons – tap the drop-down button at the top
center of the screen and the toolbar buttons will display. See on Table
4-2 Diagnostics Toolbar Buttons page 28 for detailed descriptions of the
operations for each button.
2. Main Section
Name Column – displays the parameter names.
a) Check Box – tap the check box on the left side of the
parameter name to make selection of an item. Tap the check
box again to deselect the item.
b) Drop-down Button – tap the drop-down button on the right side
of the parameter name opens a submenu, which provides
various choices for data display mode.
Value Column – displays the values of the parameter items.
Unit Column – displays the unit for the parameters.
To change the unit mode, tap the Setting button on the top
toolbar and select a required mode. See Unit on page 106 for
more information.
Display Mode
There are 4 types of display modes available for data viewing, allowing
you to view various types of parameters in the most suitable way.
Tapping the drop-down button on the right side of the parameter name
opens a submenu. There are 4 buttons to configure the data display