SMARTING User Manual – Release 11/03/2019 19
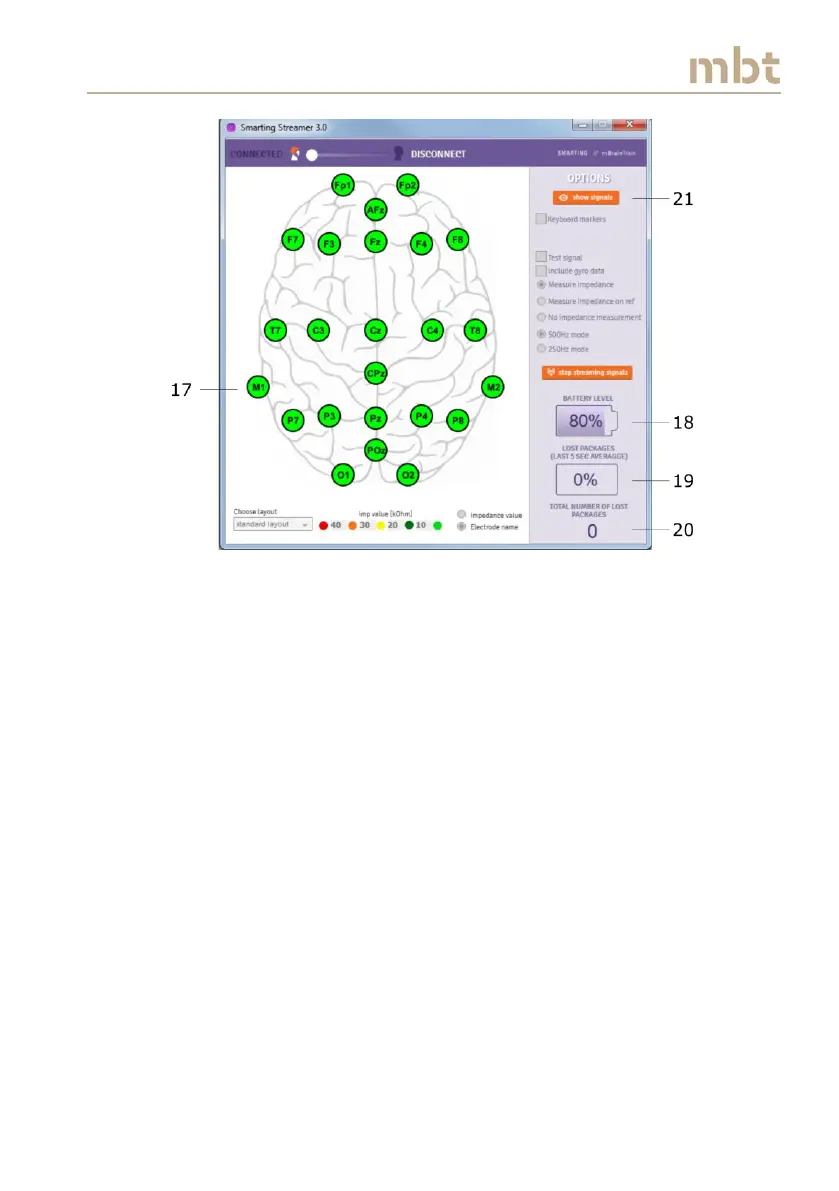
Figure 6.6 The streamer view when the signals are streaming with the impedance
measurement switched on
In order to visualize the signals, click the show signals button (21) (Figure
6.6), upon which the Signal display window is activated (Figure 6.7). If the
impedance measurements are selected, the color-coded impedance values
may be observed on the left side of the Signal display window, next to the
electrode names (22). The red line (23) is running in front of the signals and
denotes the most recent signal values. With this, it is possible to observe the
streamed signals in real-time.
More functionalities of the Signal display window will be presented in the
subchapter 6.7 (Signal display window).