SMARTING User Manual – Release 11/03/2019 23
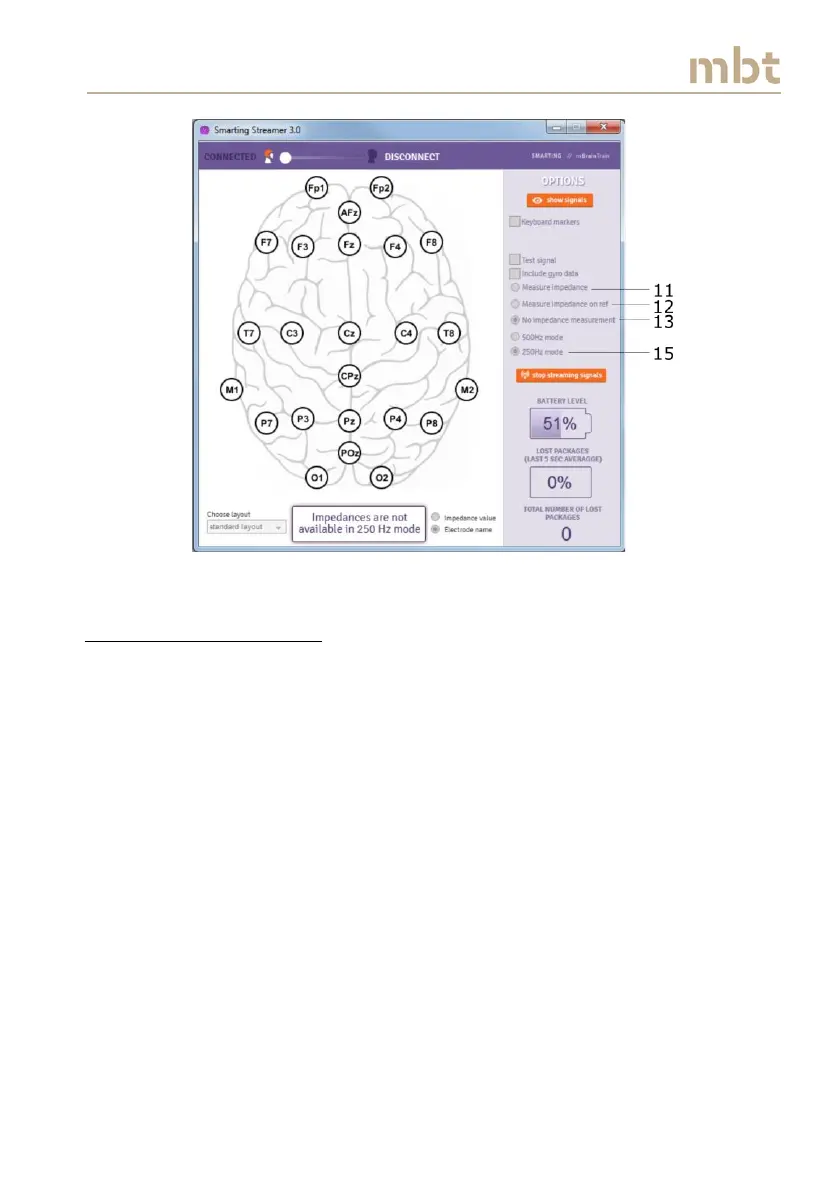
Figure 6.10 The main window interface when the sampling frequency is set to 250 Hz
6.7 Signal display window
The click on the show signals button (number 21 from Figure 6.8) starts the
Signal display window, as depicted in Figure 6.11. The Signal display window
shows the raw EEG signals from each electrode that was selected in the main
window.
The Signal display window allows visualizing the EEG (also gyroscope) signals
in real time. The red line (23) runs in front of the signals and denotes the
most recent samples. As mentioned earlier, if the impedances are switched
on, the color coded circles, that represent the impedance values, will appear
in the left part of the Signal display window, next to the electrode names
(22).