IOMM AGZ-3 AGZ 035A through 065A 11
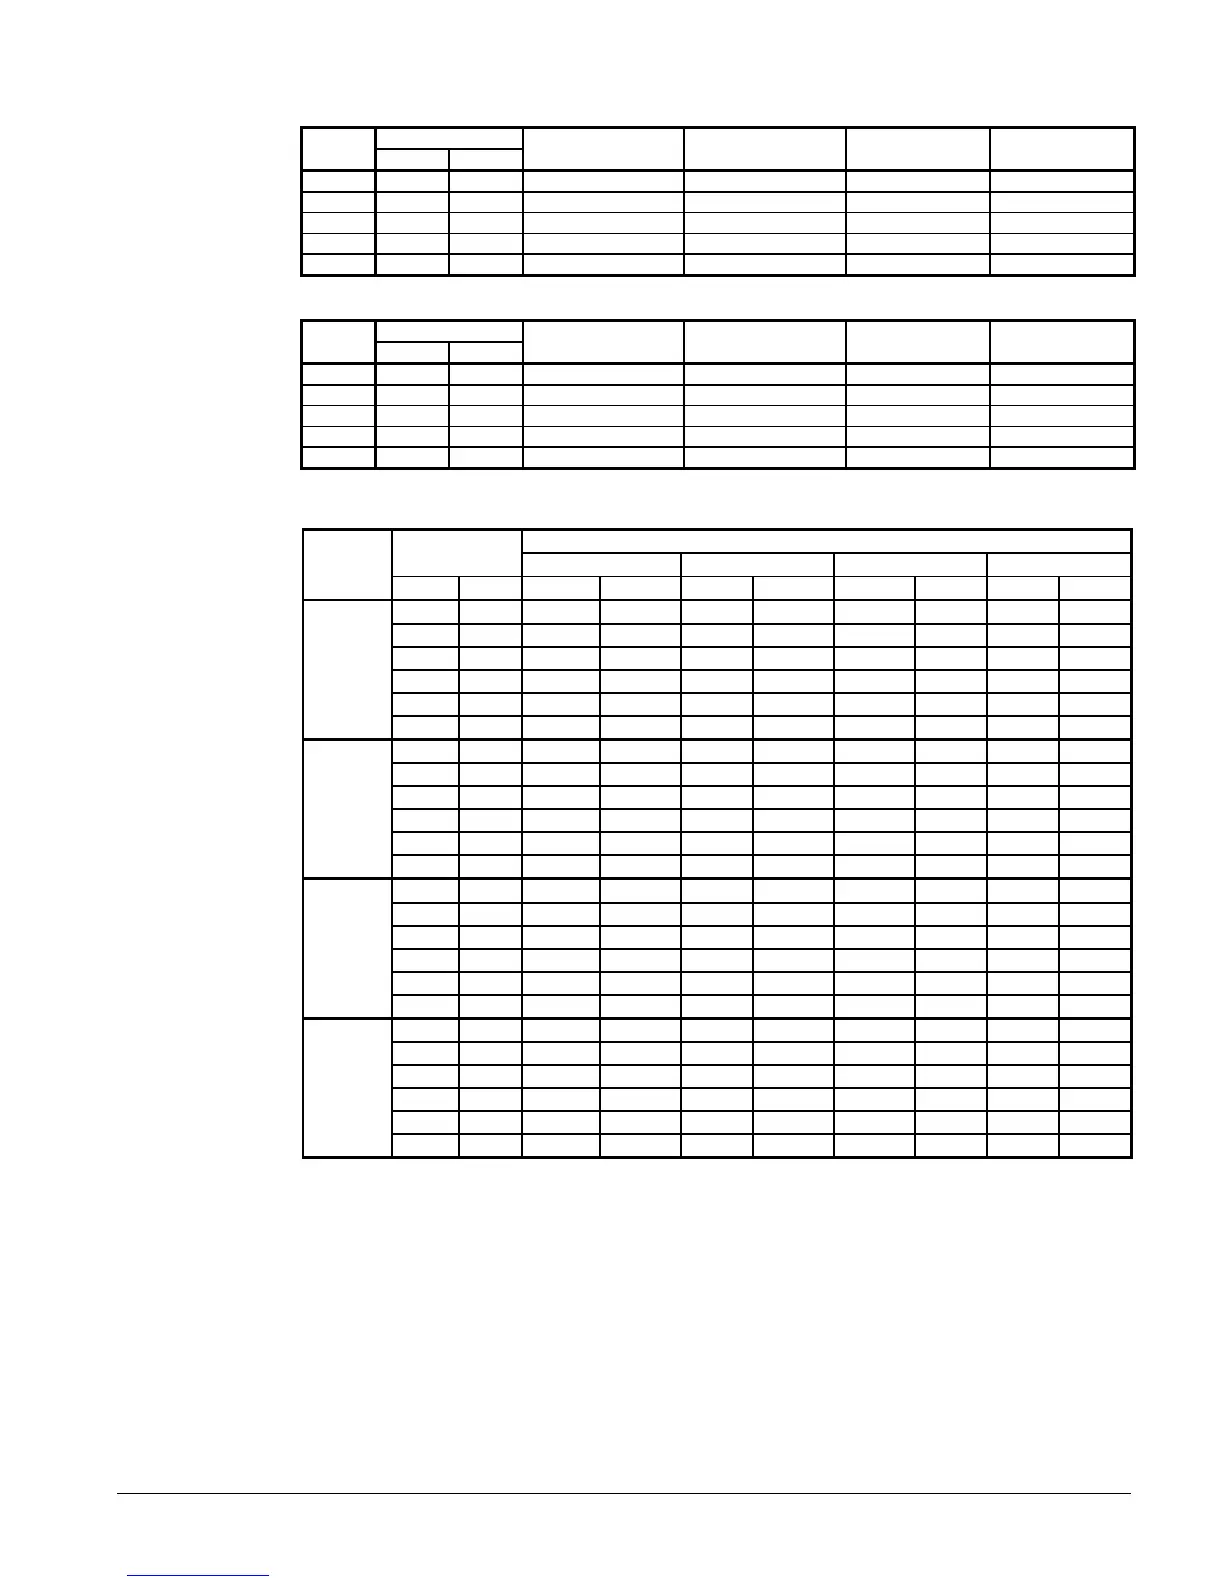
Table 4, Ethylene Glycol Correction Factors
Freeze Point
%
E.G.
°F °C
Capacity Power Flow Pressure Drop
10
26 -3 0.991 0.996 1.013 1.070
20
18 -8 0.982 0.992 1.040 1.129
30
7 -14 0.972 0.986 1.074 1.181
40
-7 -22 0.961 0.976 1.121 1.263
50
-28 -33 0.946 0.966 1.178 1.308
Table 5, Propylene Glycol Correction Factors
Freeze Point
%
P.G.
°F °C
Capacity Power Flow Pressure Drop
10
26 -3 0.987 0.992 1.010 1.068
20
19 -7 0.975 0.985 1.028 1.147
30
9 -13 0.962 0.978 1.050 1.248
40
-5 -21 0.946 0.971 1.078 1.366
50
-27 -33 0.929 0.965 1.116 1.481
Table 6, Capacity and Power Derates
Fouling Factor
Chilled Water
Delta-T
0.0001 (0.0176) 0.00025 (0.044) 0.00075 (0.132) 0.00175 (0.308)
ALTITUDE
°F °C Cap. Power Cap. Power Cap. Power Cap. Power
6 3.3 0.992 0.995 0.985 0.993 0.962 0.986 0.919 0.972
8 4.4 0.995 0.997 0.988 0.995 0.965 0.988 0.922 0.974
10 5.6 1.000 1.000 0.993 0.998 0.970 0.991 0.927 0.977
12 6.7 1.005 1.002 0.998 1.000 0.975 0.993 0.932 0.979
14 6.8 1.010 1.005 1.003 1.003 0.980 0.996 0.936 0.982
SEA
LEVEL
16 8.9 1.014 1.007 1.007 1.005 0.984 0.998 0.940 0.984
6 3.3 0.978 1.005 0.971 1.003 0.949 0.996 0.906 0.982
8 4.4 0.982 1.007 0.975 1.005 0.953 0.998 0.910 0.984
10 5.6 0.986 1.009 0.979 1.007 0.956 1.000 0.914 0.986
12 6.7 0.992 1.011 0.985 1.009 0.962 1.002 0.919 0.988
14 6.8 0.997 1.014 0.990 1.012 0.967 1.005 0.924 0.991
2000 feet
(610 m)
16 8.9 1.000 1.016 0.993 1.014 0.970 1.007 0.927 0.993
6 3.3 0.966 1.016 0.959 1.014 0.937 1.007 0.895 0.993
8 4.4 0.969 1.018 0.962 1.016 0.940 1.009 0.898 0.995
10 5.6 0.973 1.021 0.966 1.019 0.944 1.012 0.902 0.998
12 6.7 0.978 1.025 0.971 1.023 0.949 1.016 0.906 1.002
14 6.8 0.982 1.027 0.975 1.025 0.953 1.018 0.910 1.004
4000 feet
(1220 m)
16 8.9 0.986 1.028 0.979 1.026 0.956 1.019 0.914 1.005
6 3.3 0.953 1.025 0.946 1.023 0.924 1.016 0.883 1.002
8 4.4 0.955 1.028 0.948 1.026 0.926 1.019 0.885 1.005
10 5.6 0.959 1.031 0.952 1.029 0.930 1.022 0.889 1.008
12 6.7 0.963 1.034 0.956 1.032 0.934 1.024 0.893 1.011
14 6.8 0.968 1.036 0.961 1.034 0.939 1.026 0.897 1.013
6000 feet
(1830 m)
16 8.9 0.972 1.037 0.965 1.035 0.943 1.027 0.901 1.014
Evaporator Flow and Pressure Drop
Evaporator flow rate must fall between the minimum and maximum values shown in the evaporator
pressure drop table on Figure 7.
Measure the chilled water pressure drop through the evaporator at factory installed pressure taps. It is
important not to include the effect of valves or strainers in these readings.
Varying chilled water flow through the evaporator while the compressor(s) are operating is not
recommended.
 Loading...