Examples
84 MIKE 21 BW - © DHI
during or after model execution assuming you have a licence for MIKE Ani-
mator Plus.
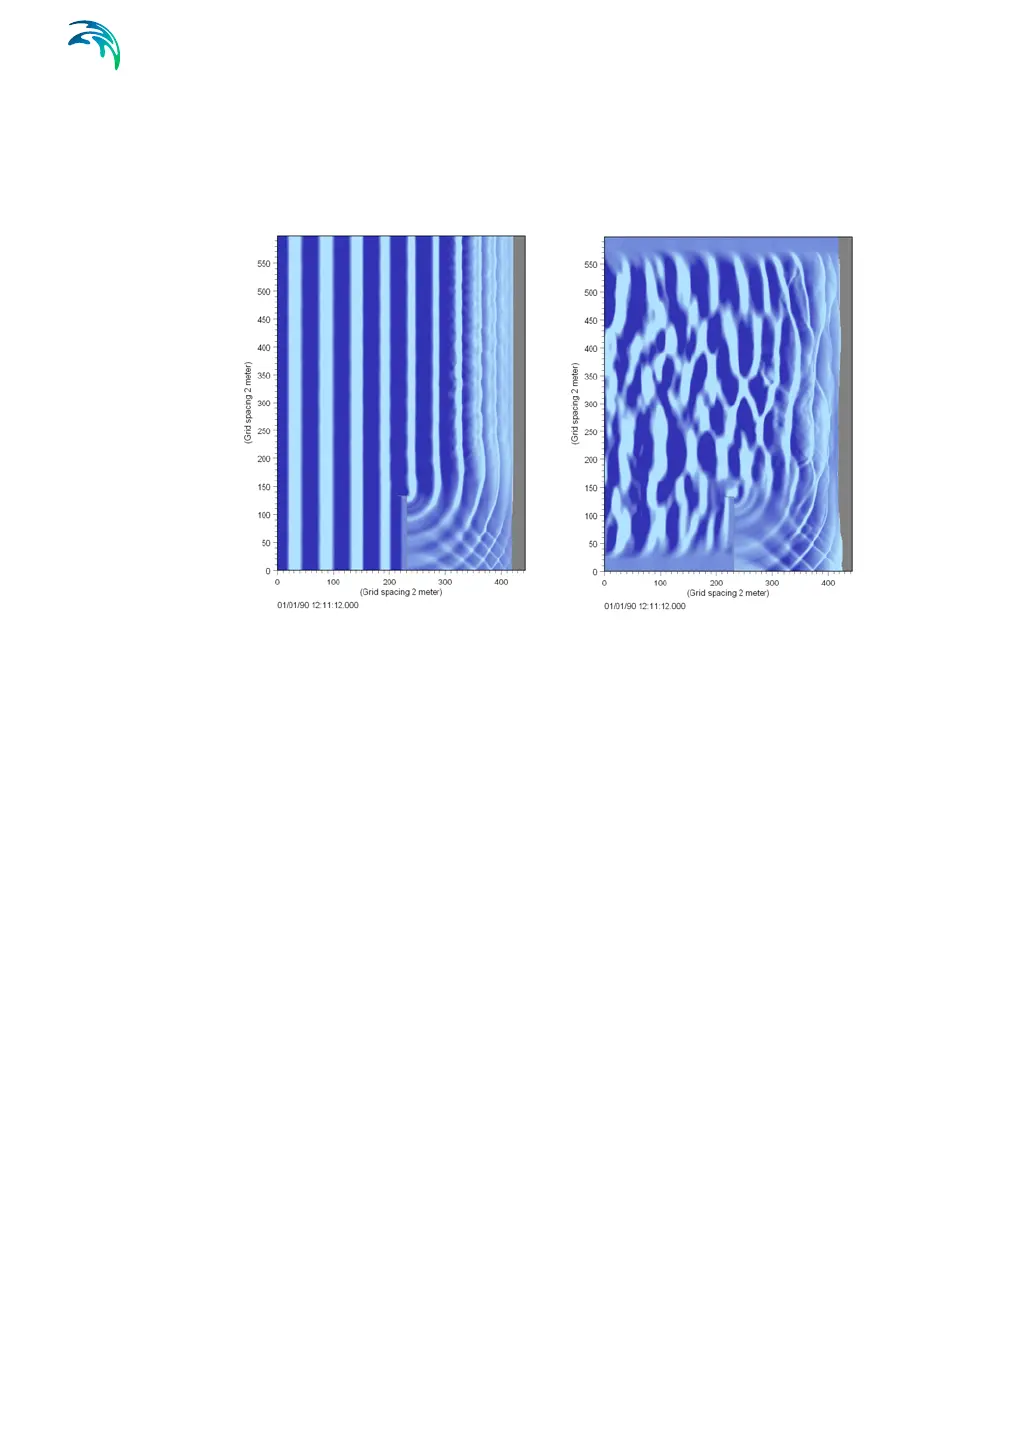
Figure 4.54 Visualisation (2D) of instantaneous surface elevation. Left panel: regu-
lar unidirectional waves, right panel: irregular directional waves
The computed wave-induced current field for the two cases is shown in
Figure 4.56. Here, the velocities are the depth-averaged velocities under the
surface roller obtained by cumulative averaging over approximately 8 (peak)
wave periods starting 7 minutes after simulation start. Wave statistics is com-
puted only in points outside the swash zone, which is the white area shown in
Figure 4.56. As described in the User Guide it is possible (through a batch
execution) to include calculation of wave statistics in the swash zone and an
example is shown in Figure 4.57. As the number of sampling values is vary-
ing in this wetting and drying zone care should be taken when the results are
interpreted.