System Diagnosis and Support 11-17
Beyond that, the status bar shows the remaining time of the test.
2. Monitoring information
Monitoring information include: current time, CPU occupation rate, memory occupation rate, CPU
temperature, DSP FPGA temperature, TRA FPGA temperature, TRB FPGA temperature, TRC
FPGA temperature (if TRA, TRB and TRC is not detected, FPGA temperature will not be displayed
on the interface).
If the temperature exceeds the working temperature, the temperature status in progress bar
appears in red.
3. System dialog box
The color of the element in the system dialog box changes according to test results during test
process. If the test fails, the element becomes red FAIL; if the test succeeds, it becomes green
PASS. If the color of the element keeps the same, it indicates the test is not preceded.
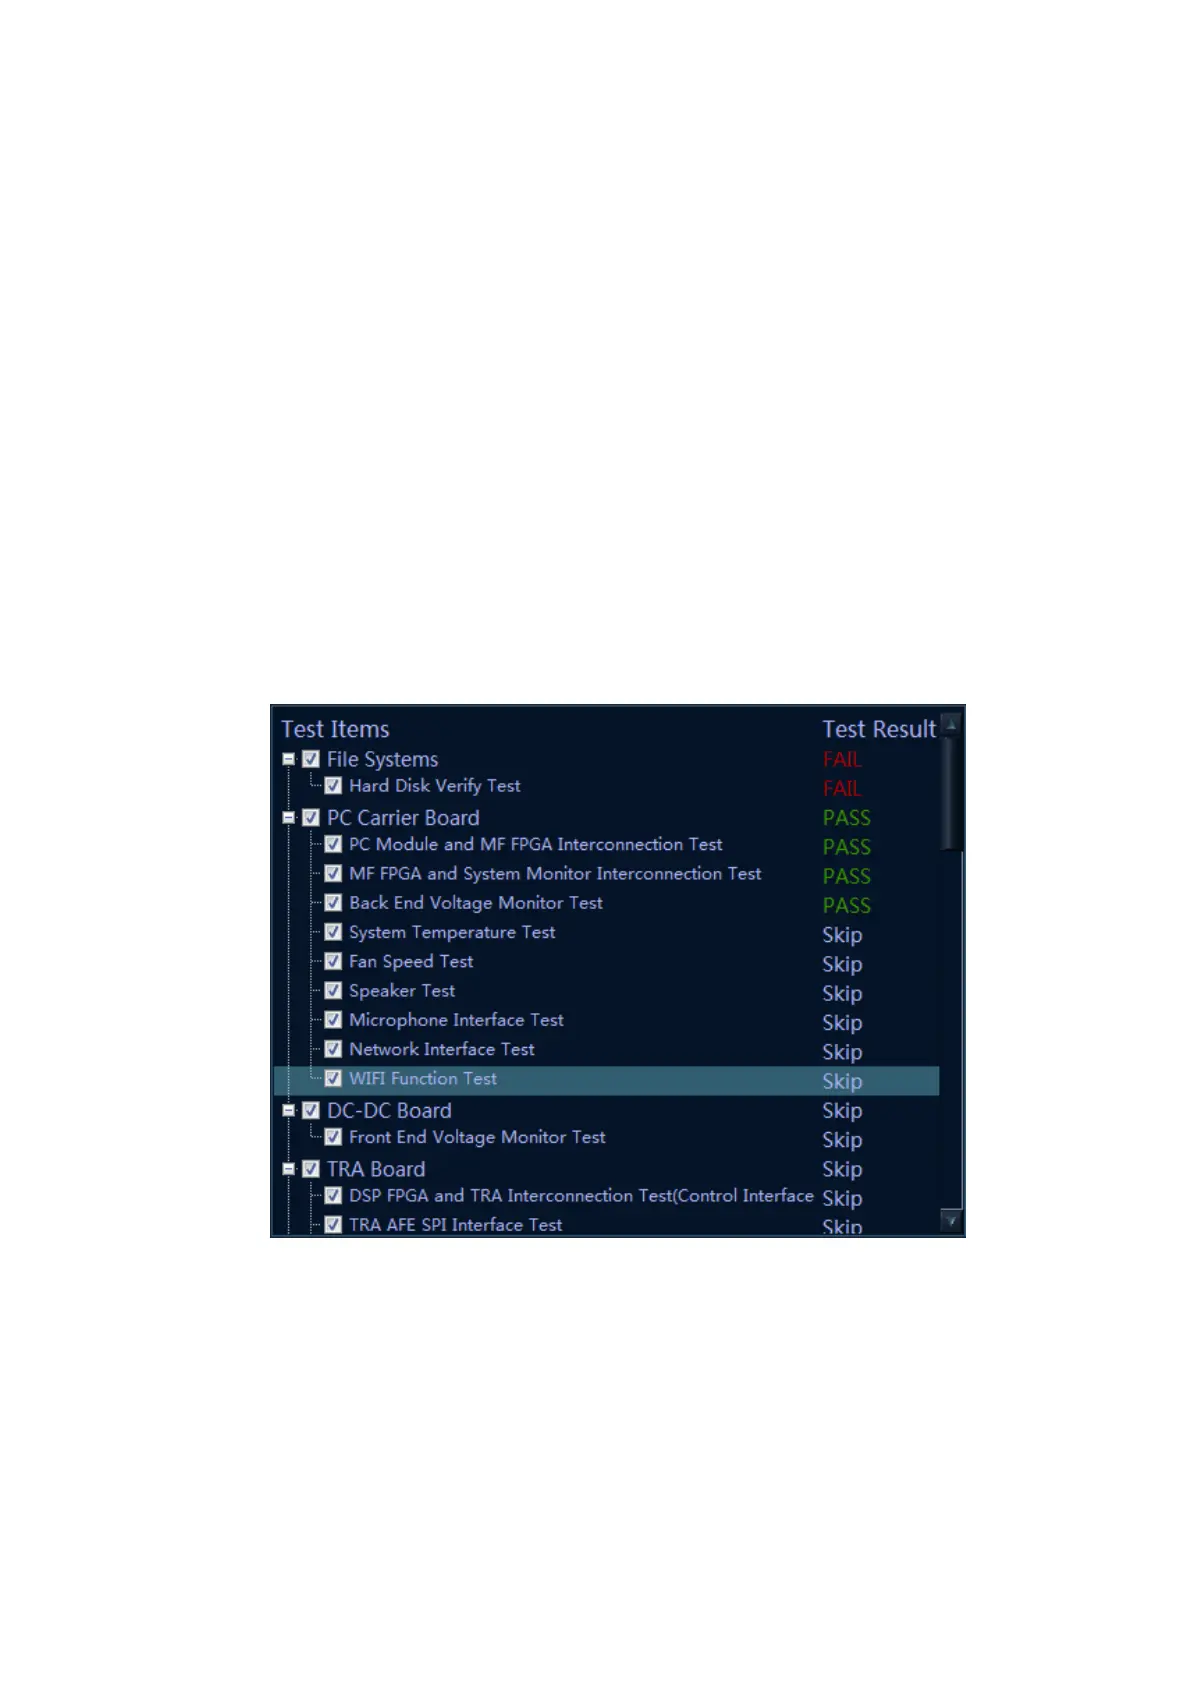
4. Test information
The test result is displayed after the test is completed. Green PASS indicates the pass of the
sub-item. Red FAIL indicates the failure of the sub-item. If the item has not been tested, it appears
in grey Skip. If the board and the assembly are not in the place, it appears in grey N/A. Red Error
appears as the test item error occurs. The test result of parent test item is the aggregate for the test
results of all selected sub-test items. If there is FAIL test in the selected list, the test result of parent
test item is FAIL. As long as the test result of the selected item is PASS, the test result of parent test
item would be PASS.As shown in the following figure.
Click each test item in Test Items list. The program searches for related test result of each test item.
The detail of the test is shown as well. See the figure below:
 Loading...