65
Downloaded data banks from Calisto/Calisto 2 monitor can be viewed using the graphic tab.
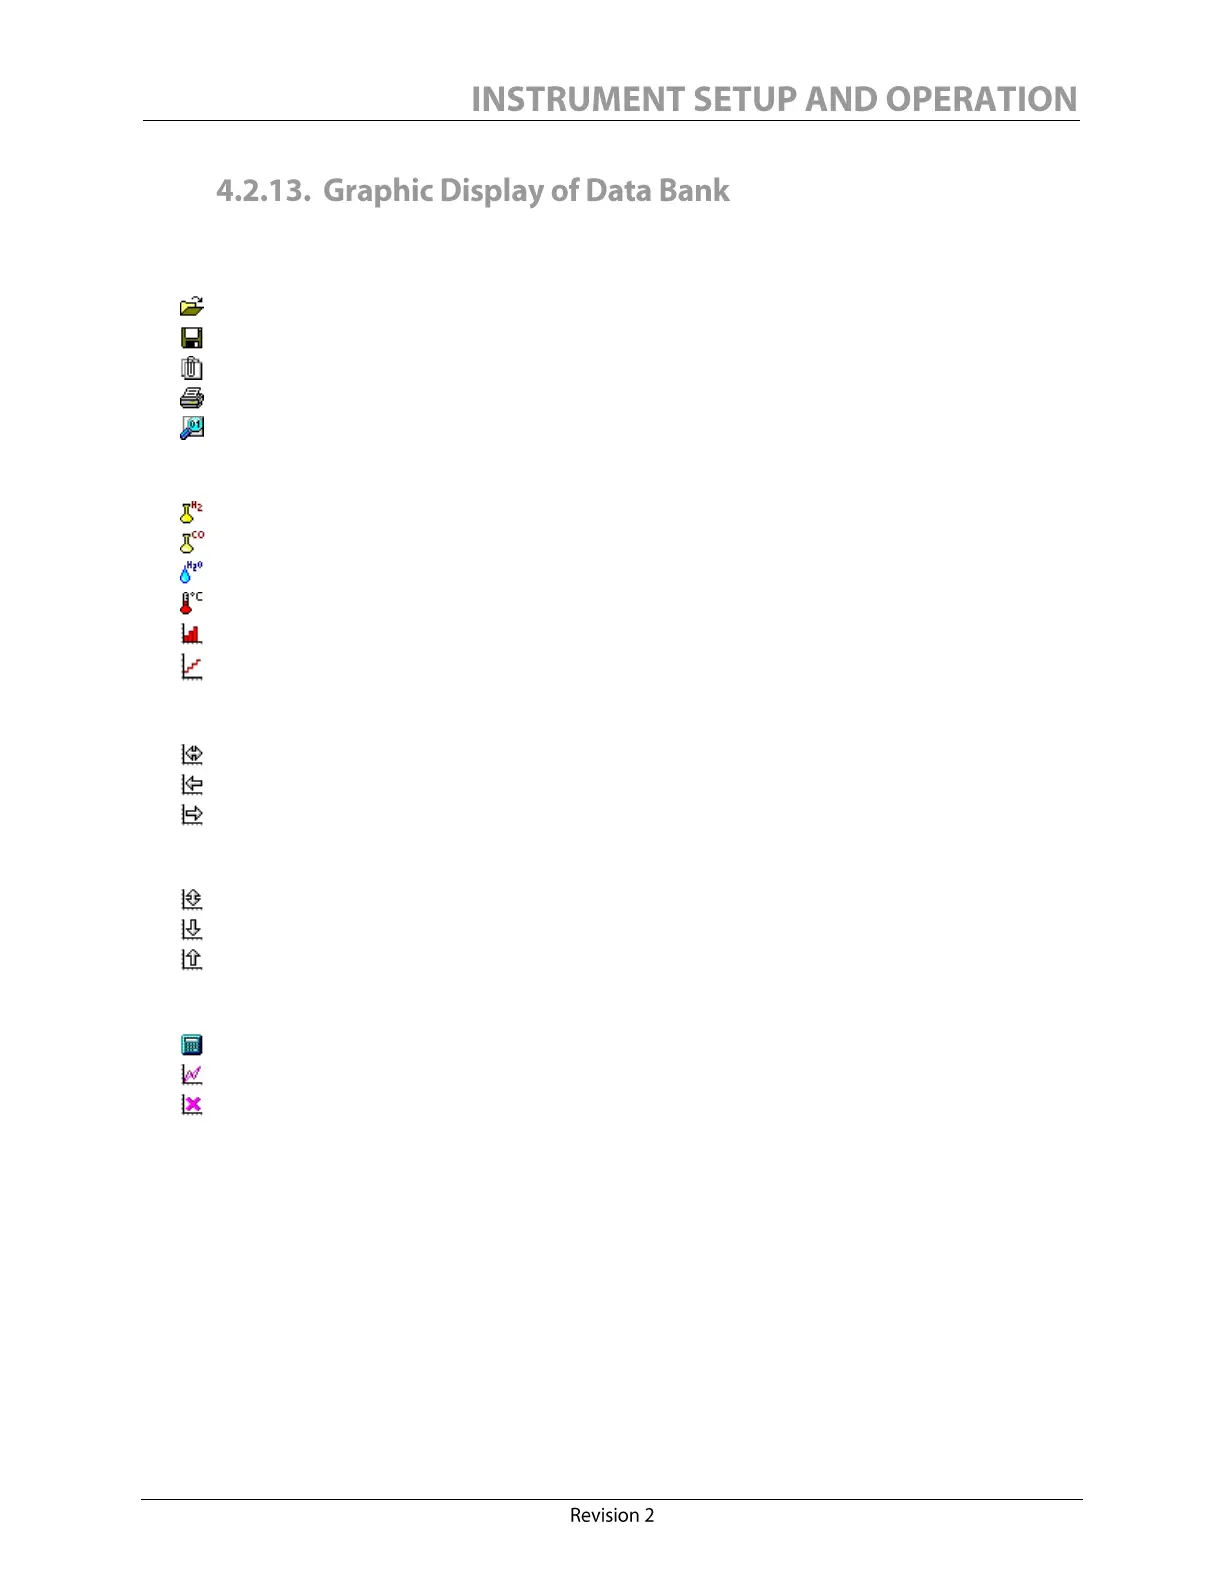
The toolbar allows user to:
Open data bank (required for any other action)
Save data bank (under a different name, or after a merge)
Merge one current data bank with another (useful for periodic partial downloads)
Print data bank (portrait or landscape, color or monochrome, all pages or selection)
View data bank (in numerical/textual columns format, ready to print)
Selection of display:
Hydrogen (in ppm)
Carbon Monoxide (in ppm) (Calisto 2 only)
Moisture (%RS at 25°C, ppm or %RS at transformer °C)
External input sensor (usually the transformer °C)
With baselines (bar graph)
Without baselines (line graph)
The X scale adjustments:
Best fit
Reduce (minimum two weeks)
Increase
The Y scale adjustments:
Best fit
Reduce (minimum 250 ppm, 100% RS or 50°C)
Increase
Other tools:
Calculate relative moisture saturation
Trend tool (adds least square linear regression lines)
Clear trends (removes all visible linear regression lines)
Moving the mouse through the graphic will display a vertical line cursor. It indicates the reference
point for the information label highlighted in the top left corner. Also, when the trend tool is
activated, click once to set the trend starting point and click a second time to set its ending point
(the minimum range is one day). A scrollbar is also available for moving through the graphic.