7
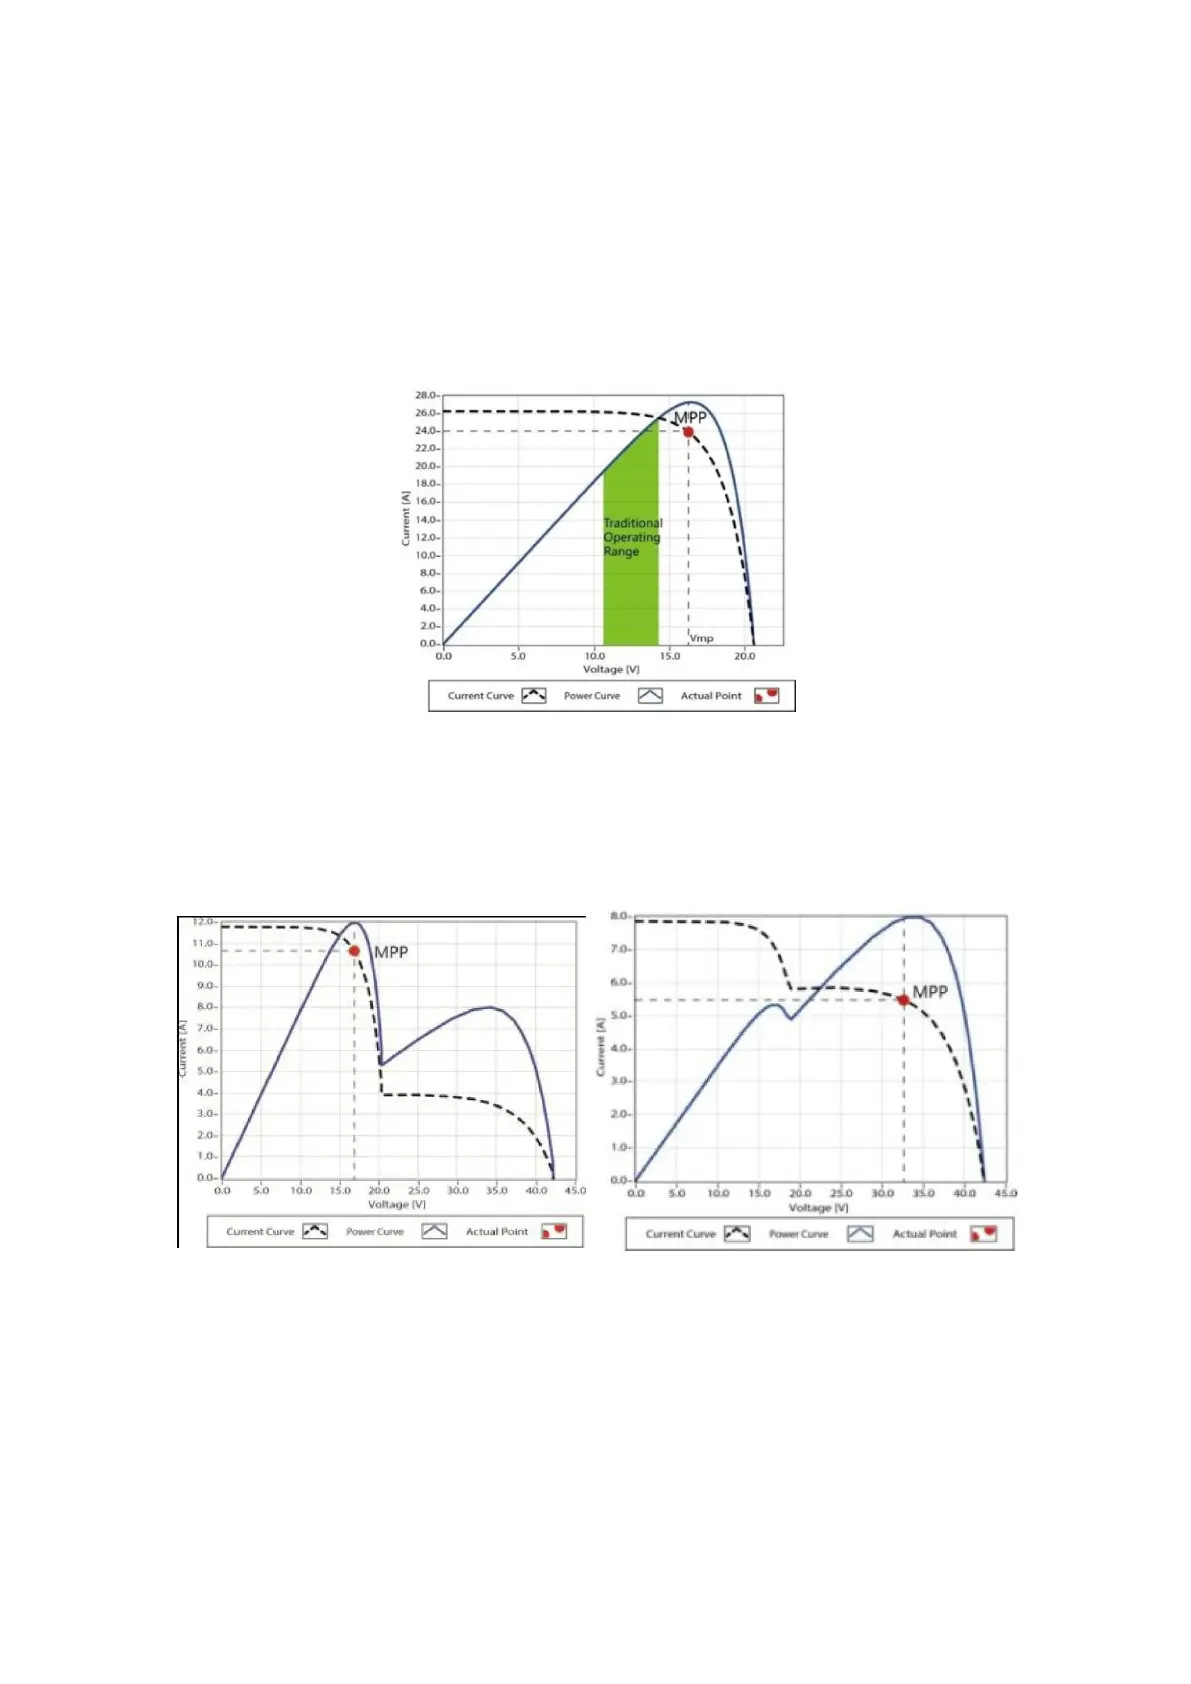
Figure 1-2 is the maximum power point curve, the shaded area is charging range of
traditional solar charge controller (PWM Charging Mode), it can obviously diagnose that
the MPPT mode can improve the usage of the solar energy resource. According to our
test, the MPPT controller can raise 20%-30% efficiency compared to the PWM controller.
(Value may be fluctuant due to the influence of the ambient circumstance and energy
loss.)
Figure 1-2 Maximum Power Point Curve
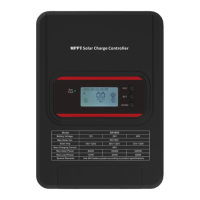
In actual application, as shading from cloud, tree and snow, the panel maybe appear
Multi-MPP, but in actually there is only one real Maximum Power Point. As the below
Figure 1-3 shows:
Figure 1-3 Multi-MPP Curve
If the program works improperly after appearing Multi-MPP, the system will not work on
the real max power point, which may waste most solar energy resources and seriously
affect the normal operation of the system. The typical MPPT algorithm, designed by our
company, can track the real MPP quickly and accurately, improve the utilization rate of
the array and avoid the waste of resources.