Universal digital repeater
DR-209M
Page 29
The description of indicator settings in Graphic data display mode is represented
in Table 17.
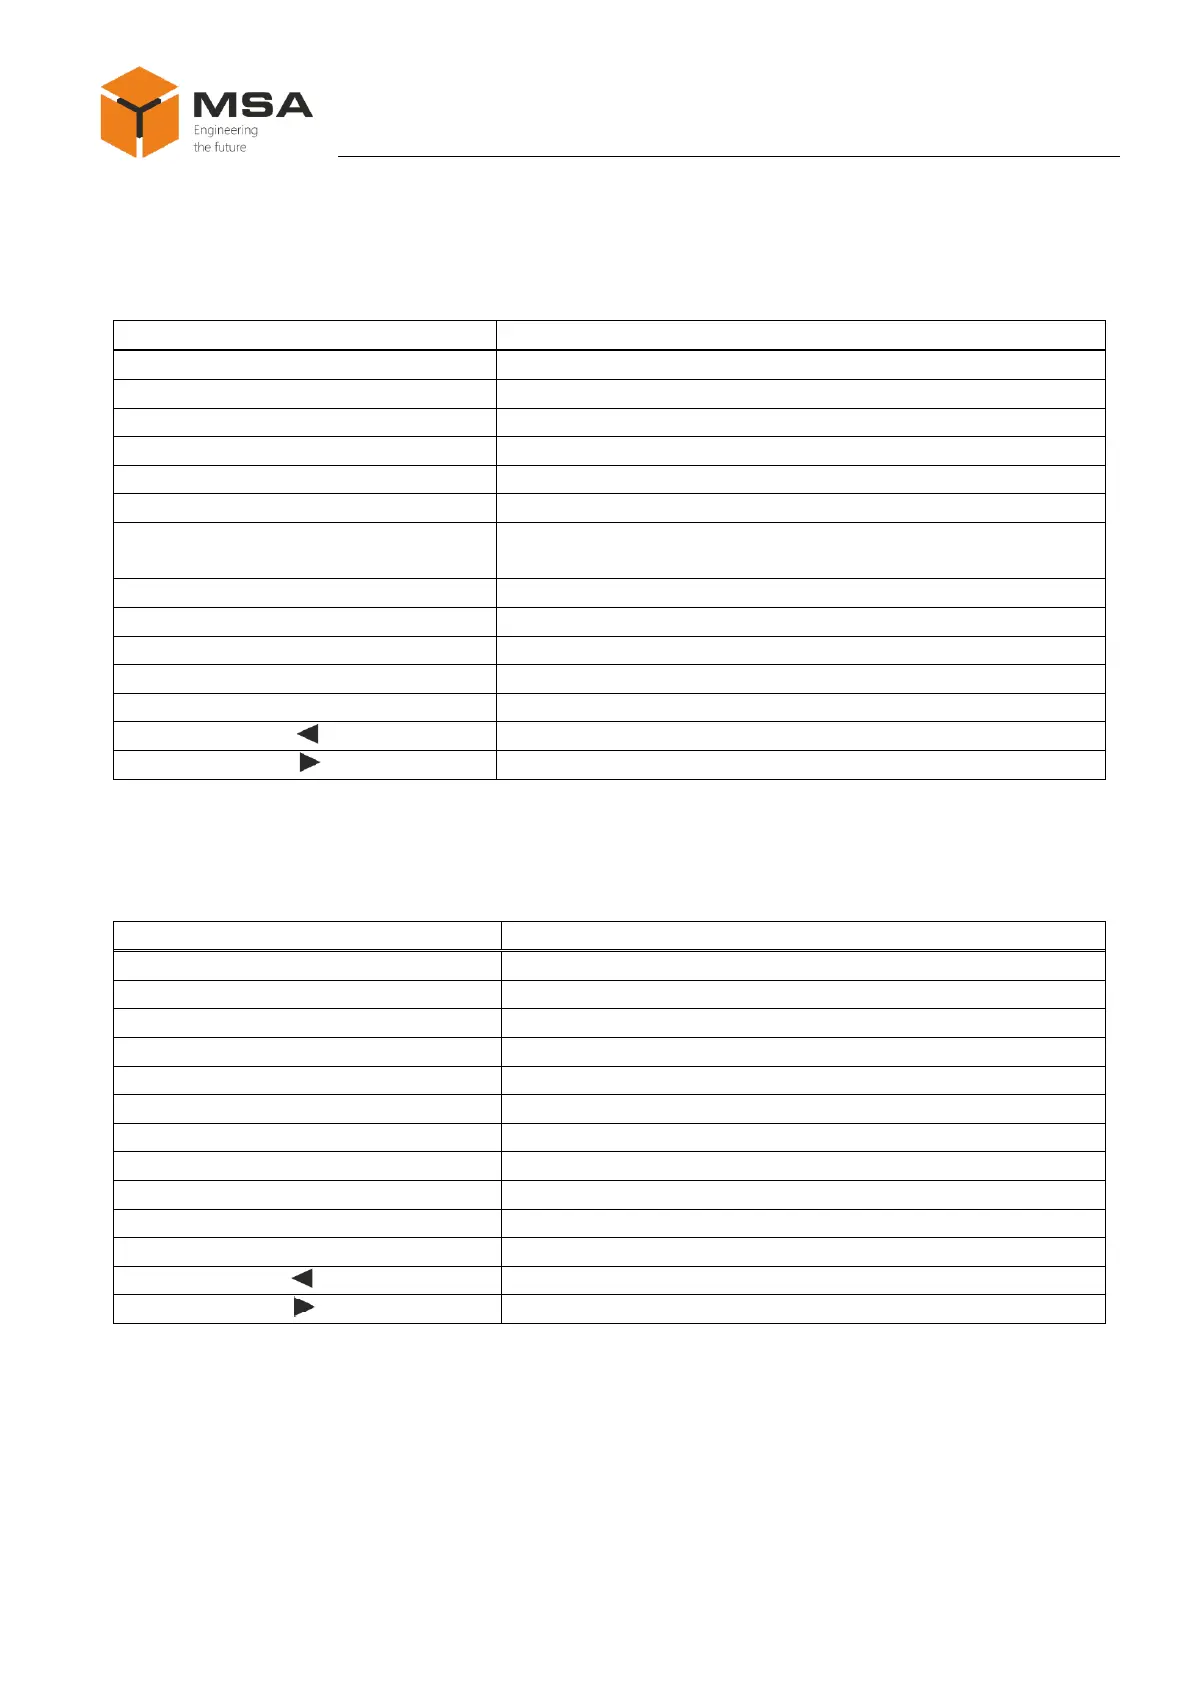
Table 17 – The description of indicator settings in Graphic data display mode
To display data from the Primary source
To display data from the Secondary source
To set a status for data source Primary
To set a status for data source Secondary
To set a min. value for measured parameter
To set a max. value for measured parameter
To set a starting point for critical values of measured param-
eter
To split all scale to set number of segments
To split each segment into set number of divisions
To cancel the selected settings
To confirm the select of data source settings
The description of indicator settings in Graph data display mode is represented in
Table 18.
Table 18 – The description of indicator settings in Graph data display mode
To display data from the Primary source
To display data from the Secondary source
To set a status for data source Primary
To set a status for data source Secondary
To set a min. value for measured parameter
To set a max. value for measured parameter
To set a number of rows along a coordinate axis
To set a period of parameter change
To set values (units) for period of parameter change
To cancel the selected settings
To confirm the select of data source settings