NV30/NV40 Operations and Maintenance Manual Operating the transmitter
Page 2-38 Issue 3.3 2014-12-10
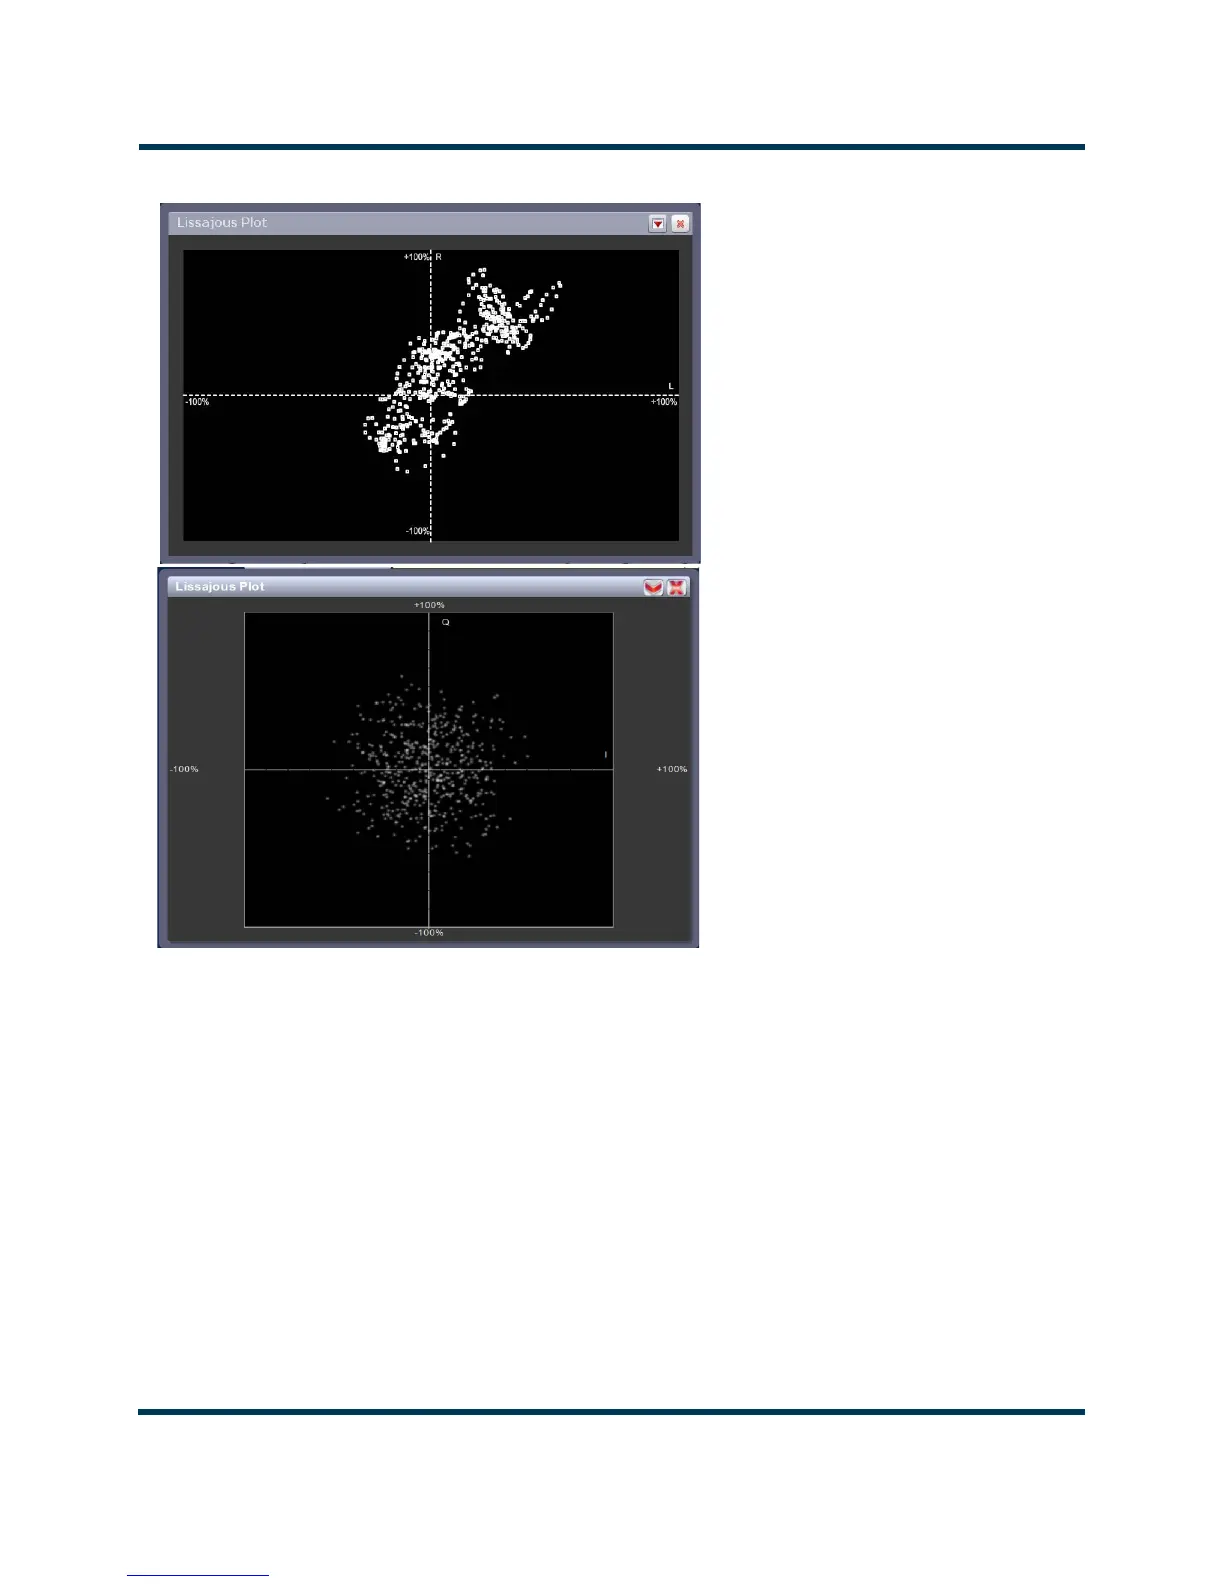
Figure 2.28: Lissajous Plot
Lissajous plot
See Figure 2.28. This panel displays a Lissajous figure that represents either L (left) and R (right)
audio content or a representation of the FM modulated signal [I (in-phase) and Q (quadrature)]. I and
Q will be automatically selected unless the transmitter is operating in stereo mode or not operating in
IBOC. Left and right audio content is displayed for all other audio sources.
The plot consists of a group of sequential samples to allow signal analysis. In L and R mode, the L+R
portion of the signal tends to dominate the plot, resulting in the majority of samples appearing in the
lower, left and upper, right quadrants. In I and Q mode, signals that are of equal frequency and 90
degrees out-of-phase result in a circular display.
Use the maximize or minimize buttons as required..
 Loading...