22 Installing the System Piping
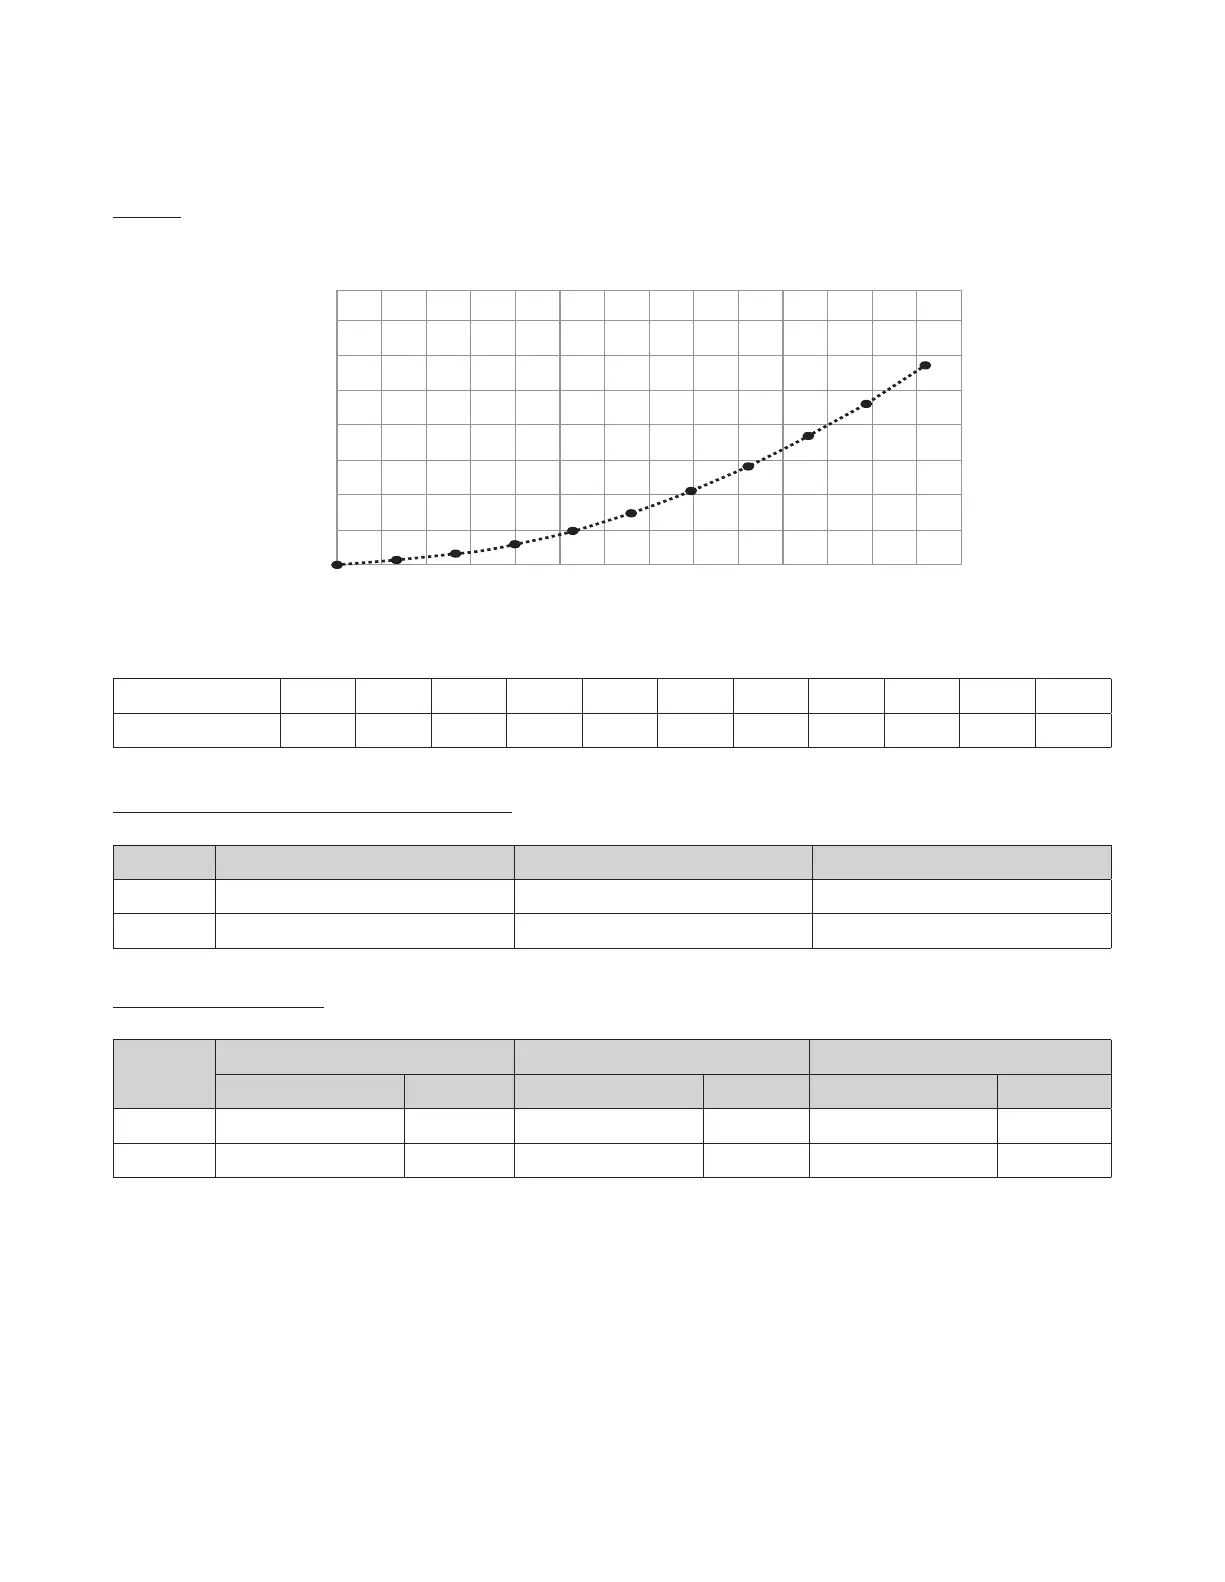
PQ Curve
NFB-175/200
H[ft]
Q[GPM]
0
2
4
6
8
10
12
14
16
0 2 4 6 8 10 12
14
16 18 20 22
24 26
28
Q [GPM] 0 2.6 5.3 7.9 10.6 13.2 15.9 18.5 21.1 23.8 26.4
H [ft] 0 0.3 0.7 1.1 2 3 4.3 5.6 7.4 9.2 11.5
Maximum and Minimum Flow Rates through the Boiler
Model Minimum Pipe Diameter Maximum Flow (GPM) Minimum Flow (GPM)
NFB-175 1
1
/
4
" 23.1 7.0
NFB-200 1
1
/
4
" 26.4 8.0
Temperature Rise Conditions
Model
20°F ΔT @ 100% water 25°F ΔT @ 100% water 35°F ΔT @ 100% water
Flow Rate (GPM) Head (Ft) Flow Rate (GPM) Head (Ft) Flow Rate (GPM) Head (Ft)
NFB-175 16 4.2 13 2.9 9 1.4
NFB-200 18 5.3 15 3.9 11 2.1
 Loading...