When the tympanogram is completed, the values in the right box are updated, and the pump seeks to the point
of maximum compliance. Then the reflex test is carried out. Be sure to keep the probe very still while this is
running, even small movements will add noise to the reflex graph.
After the reflex test, a “REMOVE” message is shown, and the probe can be removed. The test result is now
stored in the memory at the selected ID position.
2.3 Reading the display
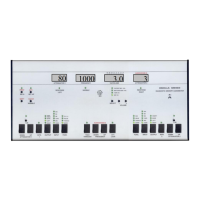
After having carried out a measurement you can see the results on the display. The picture below shows a
typical measurement of a normally functioning ear.
The picture is divided into three main sections. The tympanogram is shown in the upper section, the reflex test in
the lower, and to the right there is a box with four values obtained from the tympanogram.
Tympanogram:
The tympanogram shows the graph of the middle ear compliance, as a function of pressure. The X-scale is the
pressure, given in deka Pascal (daPa). This is nearly the same as millimetres of water (mmH2O), as 1.02
mmH2O is approx. 1.0 daPa. The Y-scale is the compliance given in equivalent volume of air, in millilitres. Inside
the tympanogram frame is a box. If the peak of the measured graph is inside this box, the ear condition can be
considered normal.
Reflex test:
This shows the ear’s reflex response to the 5 test tones. Stimulus tones of 105 dB SPL at 500, 1000, 2000, 3000
and 4000 Hz are presented as short bursts. If a change in compliance greater than 0.05 ml is detected, a reflex
is considered present. Because this is an extremely small compliance change, any movement of the probe
during the test may produce an artefact (false response). If the tympanometric results display any abnormal
findings, the results of the acoustic reflex testing may be inconclusive and should be interpreted with care.
Theoretically, a compliance peak is necessary to observe a reflex at peak pressure.
Measurement box:
In the box to the right, the numerical measurements are displayed:
MID EAR PRESS indicates the pressure with the highest measured compliance (in the example 0 daPa).
EAR VOLUME indicates the volume of the section between the ear tip and the eardrum in ml (example 1.87 ml).
COMPLIANCE indicates the value of the compliance from the tympanogram, in ml (example 0.97 ml).
TYMP WIDTH is the width of the peak at half the peak height, related to -200daPa (example 46 daPa).
In addition to the three main sections, the following other items appear:
Status indicator:
In the top right corner, the status indictor is shown. This tells you what state the device is in. The message can
be one of the following:
READY indicates that the instrument is ready for testing.
BLOCKED indicates that probe tip is blocked. This may be caused by misalignment of the probe in the ear.
LEAK indicates that the air seal between the probe and the ear is not tight.
TYMP indicates that the tympanometric test is in process.
REFLEX indicates that the reflex test is in process.
REMOVE indicates that the test is finished and the probe can be removed.
 Loading...