Philips Semiconductors
TDA1562Q application note
Koninklijke Philips Electronics N.V.
Application note Rev. 01.02 — 05 May 2006 45 of 62
7. Measurement curves
In this final chapter some additional measurement curves will be shown to show the
performance that can be expected with a properly designed application.
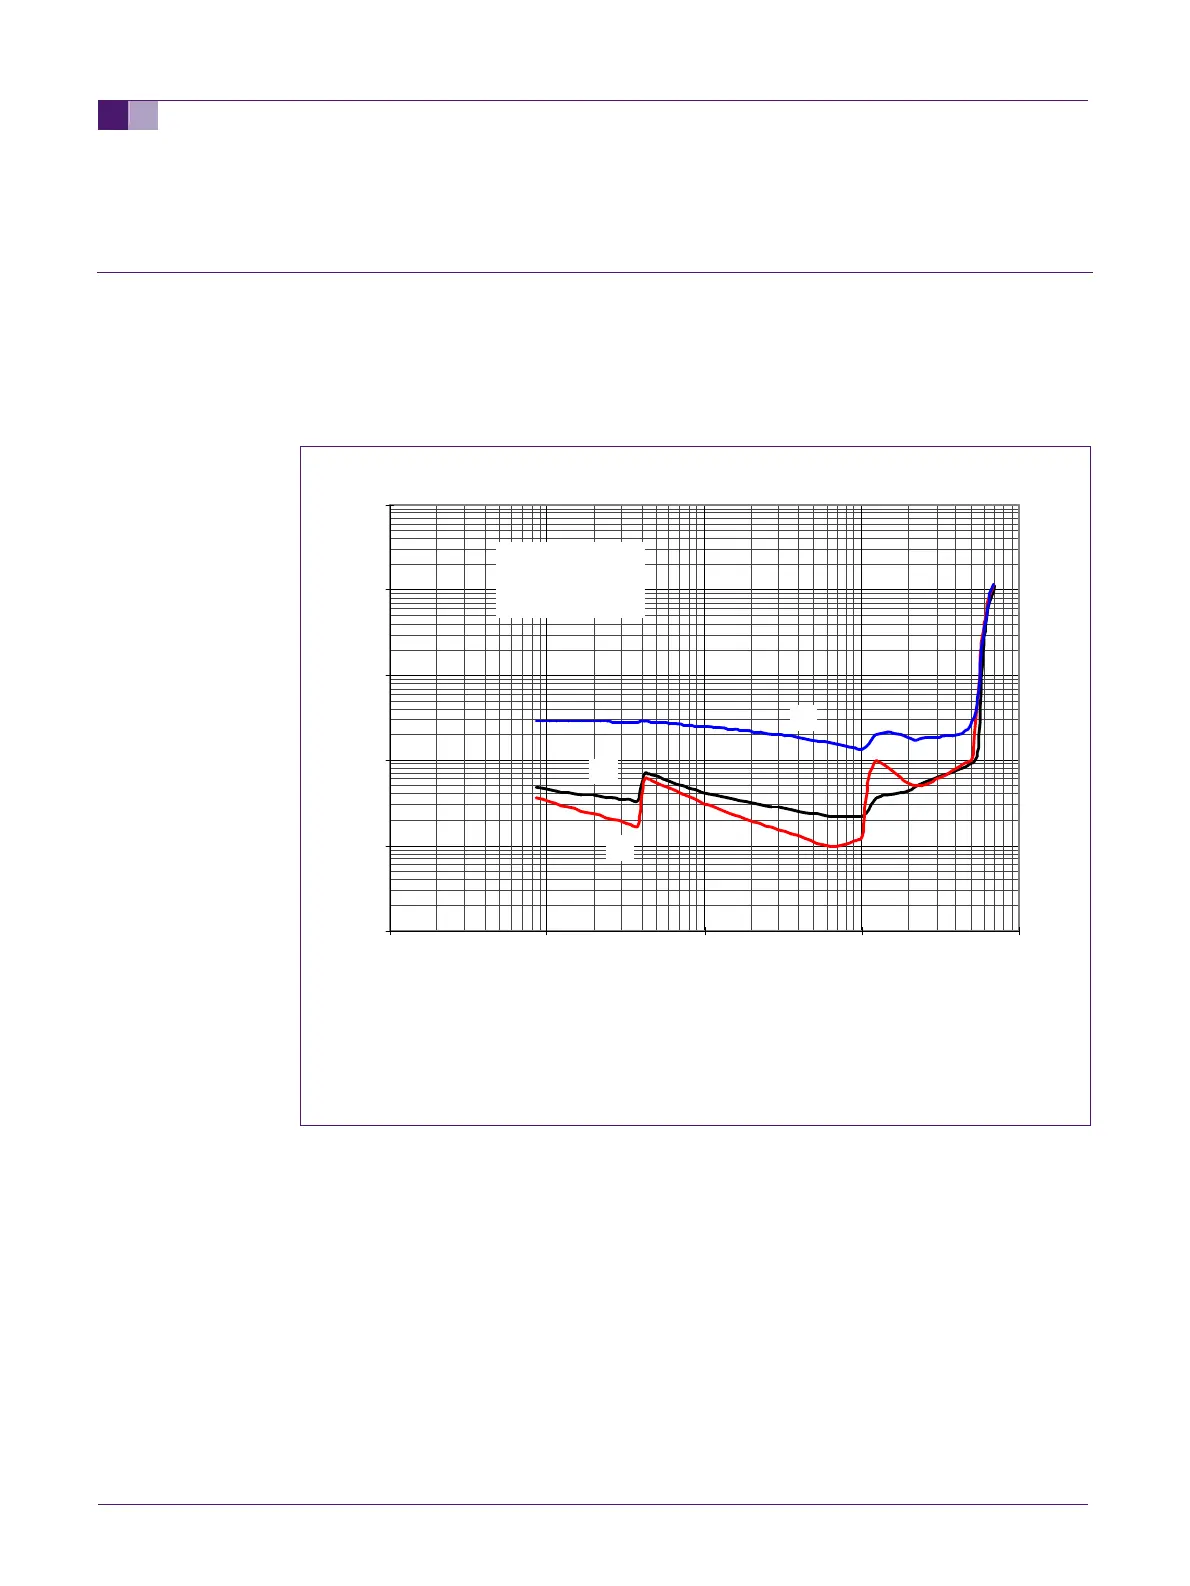
A: f=1kHz
B: f=100Hz
C: f=10kHz
Fig 33. Output power vs. THD at a supply voltage of 14.4V, with a 4Ω load
The Po vs. THD curves show the performance of the TDA1562 at frequencies of 100Hz,
1kHz and 10kHz. The “bump” at 10W output powers shows the level at which the lifting
circuitry becomes active. The notch in the 100Hz and 1kHz curves is caused by internal
circuitry.
0.001
0.01
0.1
1
10
100
0.01 0.1 1 10 100
Po(W)
THD(%)
A
B
C
Vp=14.4V
Rl=4ohms
Clift=8200uF/16V