Bank account no.: Rabobank 16 01 00 046
Chamber of commerce 27 16 95 41
IBAN Code: NL95 RABO
T. 31 (0) 10 522 43 73
F. 31 (0) 10 521 19 41
www.tamson.com
info@tamson.com
P.M. Tamson Instruments bv
van 't Hoffstraat 12
2665 JL Bleiswijk
THE NETHERLANDS
Tamson Instruments bv
Thermometer man.docx Rev 1.02 UK “23
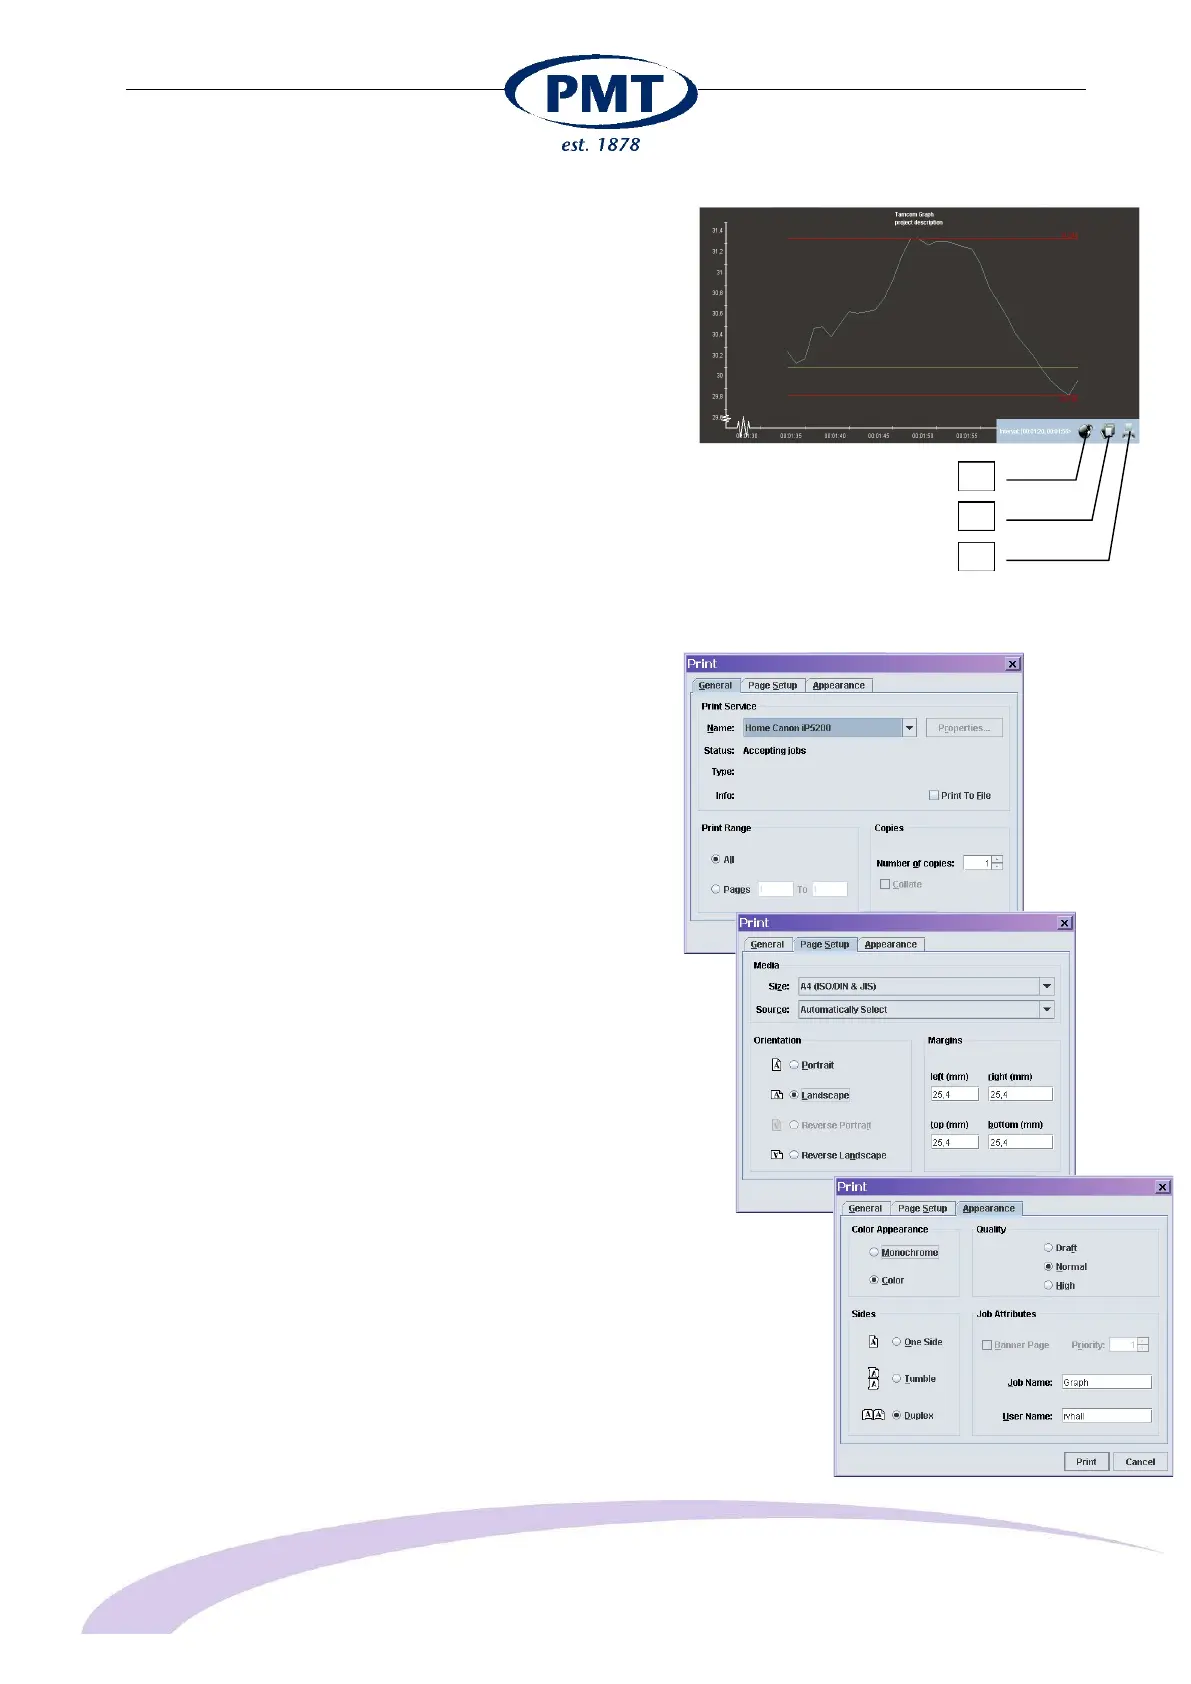
8.4.3 Zoom function
Use your right mouse button to select a specific part of the
graph. Keep the button pressed and move button to the left
or right. When released this part of the graph is zoomed in.
Click the "bomb" icon to return to the full graph.
1 Return from zoom
2 Save data onto hard-disk
3 Print data
8.4.4 Saving data
Apart from printing the graph can be exported in "PNG" format
(license free replacement for GIF format) and can be used in
Microsoft Word. Also available is SVG (Scalable Vector
Graphics).
Export to a spreadsheet the data is available as CSV (comma
separated value):
Time,Setpoint,Proces
Value
00:00,10,"23,863"
00:00:01,10,"23,878"
00:00:02,10,"23,889"
00:00:03,10,"23,892"
etc.
8.4.5 Printing data
Printing the graph using the print button (bottom left):
- And sub-menu "Page setup"
- And sub-menu "Appearance
1
2
3