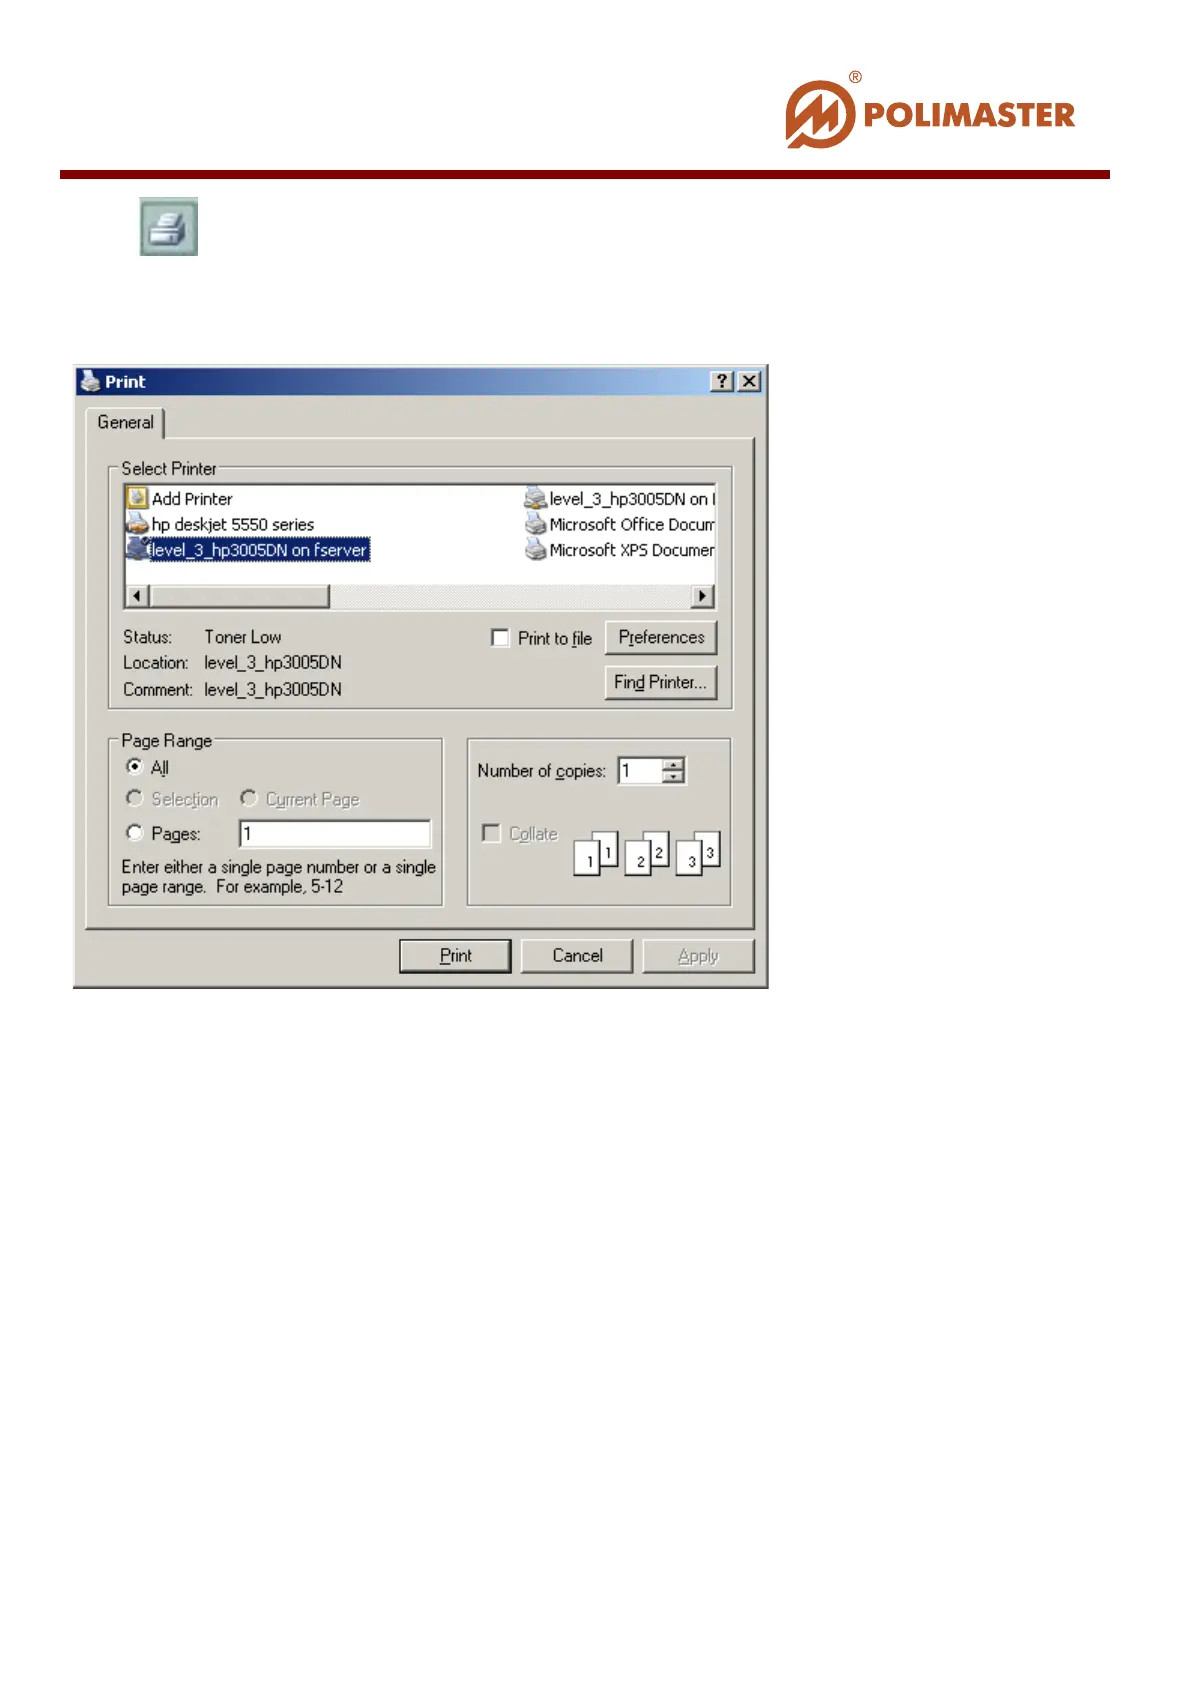
Press toolbar button to print the report.
Standard Print window opens where user can select the printer and configure print settings.
Configure all required settings and press Apply (OK) and then Print buttons.
WORKING WITH GRAPH
Program automatically generates DER Graph and DE Graph correspondingly on the basis
of read history in the table.
History graphic representation is the most convenient way for the user to view and analyze
variable DER and DE values (Y1 and Y2 axis) during time period (X axis).
User can narrow time interval so that to detail DER or DE view graph area. The graph is
being zoomed automatically.
____________________________________________________________________________________
© 2016 Software Guide www.polimaster.com
133