93-520-20 Issue 3.3 Page 44 of 60 CirrusPro Engineer’s Manual
Note that most of the following can be carried out from a Display Unit on the CirrusPro network. See
Section 3.4.
See section 3.2.1 to 3.2.4 for initial set up of the PC connection and fault reporting.
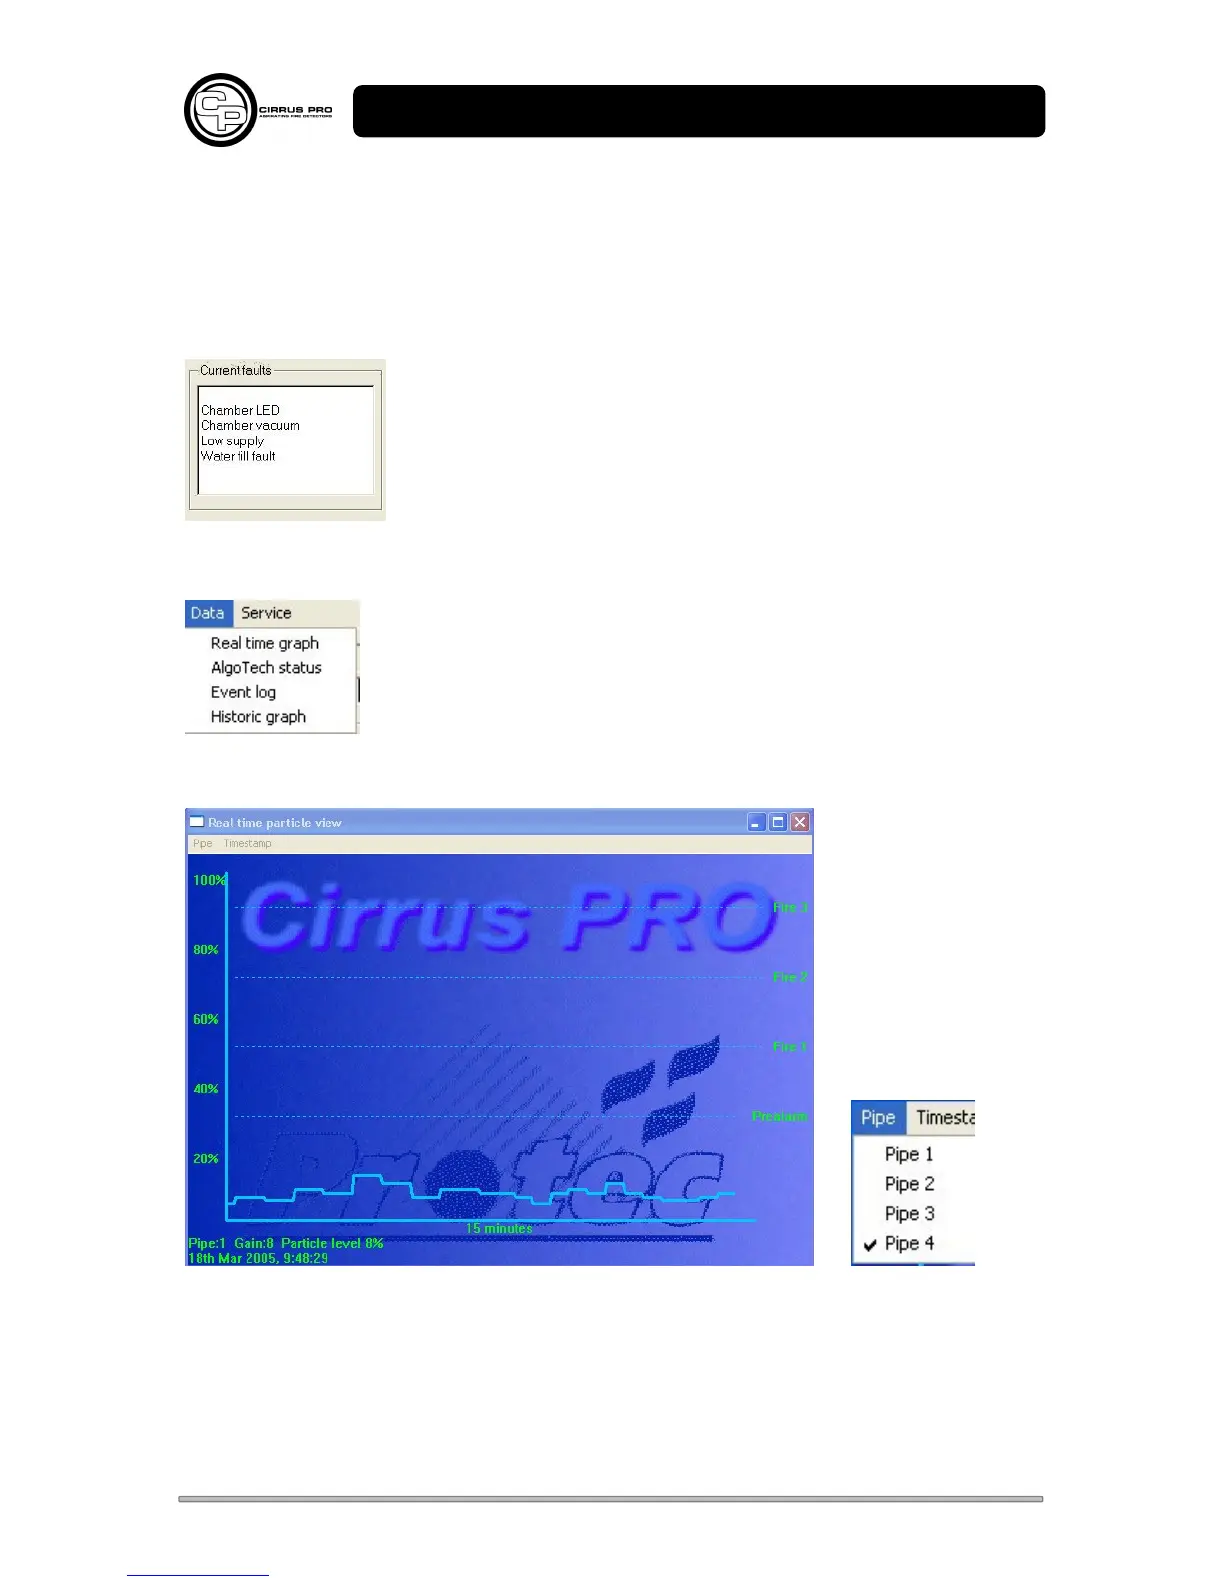
Rectify any faults in the Current Faults window, found during the power up sequence. Refer to the
Fault Finding in Section 5.
4.2 Data Menu
4.2.1 Real Time Graph
Shows the current Cirrus Pro signal levels for a 15-minute period for the selected pipe.
The data is built up from when the graph is openned and continues while connected to the PC for all
pipes.
Particle levels, and how close they are to the alarm levels, can easily be monitored.