31
calculated using permittivity that is set in the Georadar Adjustment dialog box. You can
also change permittivity levels of a sounded medium after receiving data in the Main menu
Output parameters option .
Important. Since there a distance between transmitting and receiving antennas (the
antennas offset), the simple time-depth recalculation contains the error. This error depends
on offset and measured depth ratio, because simple recalculation doesn’t consider direct
wave propagation time between transmitter and receiver. This error will be significant on
small depths especially on the depths close to the distance between the antennas. Therefore
there is Processing/Moveout correction program that excludes this error. You need to
setup Zero Point correctly before using Moveout correction. To perform Moveout
correction program enter correct distance between antennas. Georadar data already
contains this distance for all "Zond-12e" antennas and will be setup by default, but you can
still change it if it is required. We recommend applying this procedure every time no
matter the depth you are working with.
You can display profile as a Wiggle plot (Fig. 4.2), setting this this mode in the Main
menu Output parameters option (or toolbar button ). Here you could also chose to
display profile as a combined Line scan + Wiggle plot view.
Application tools used when working with sounding data files are described below,
they are located in Tools option menu and duplicated as a toolbar buttons (Fig. 7.1.).
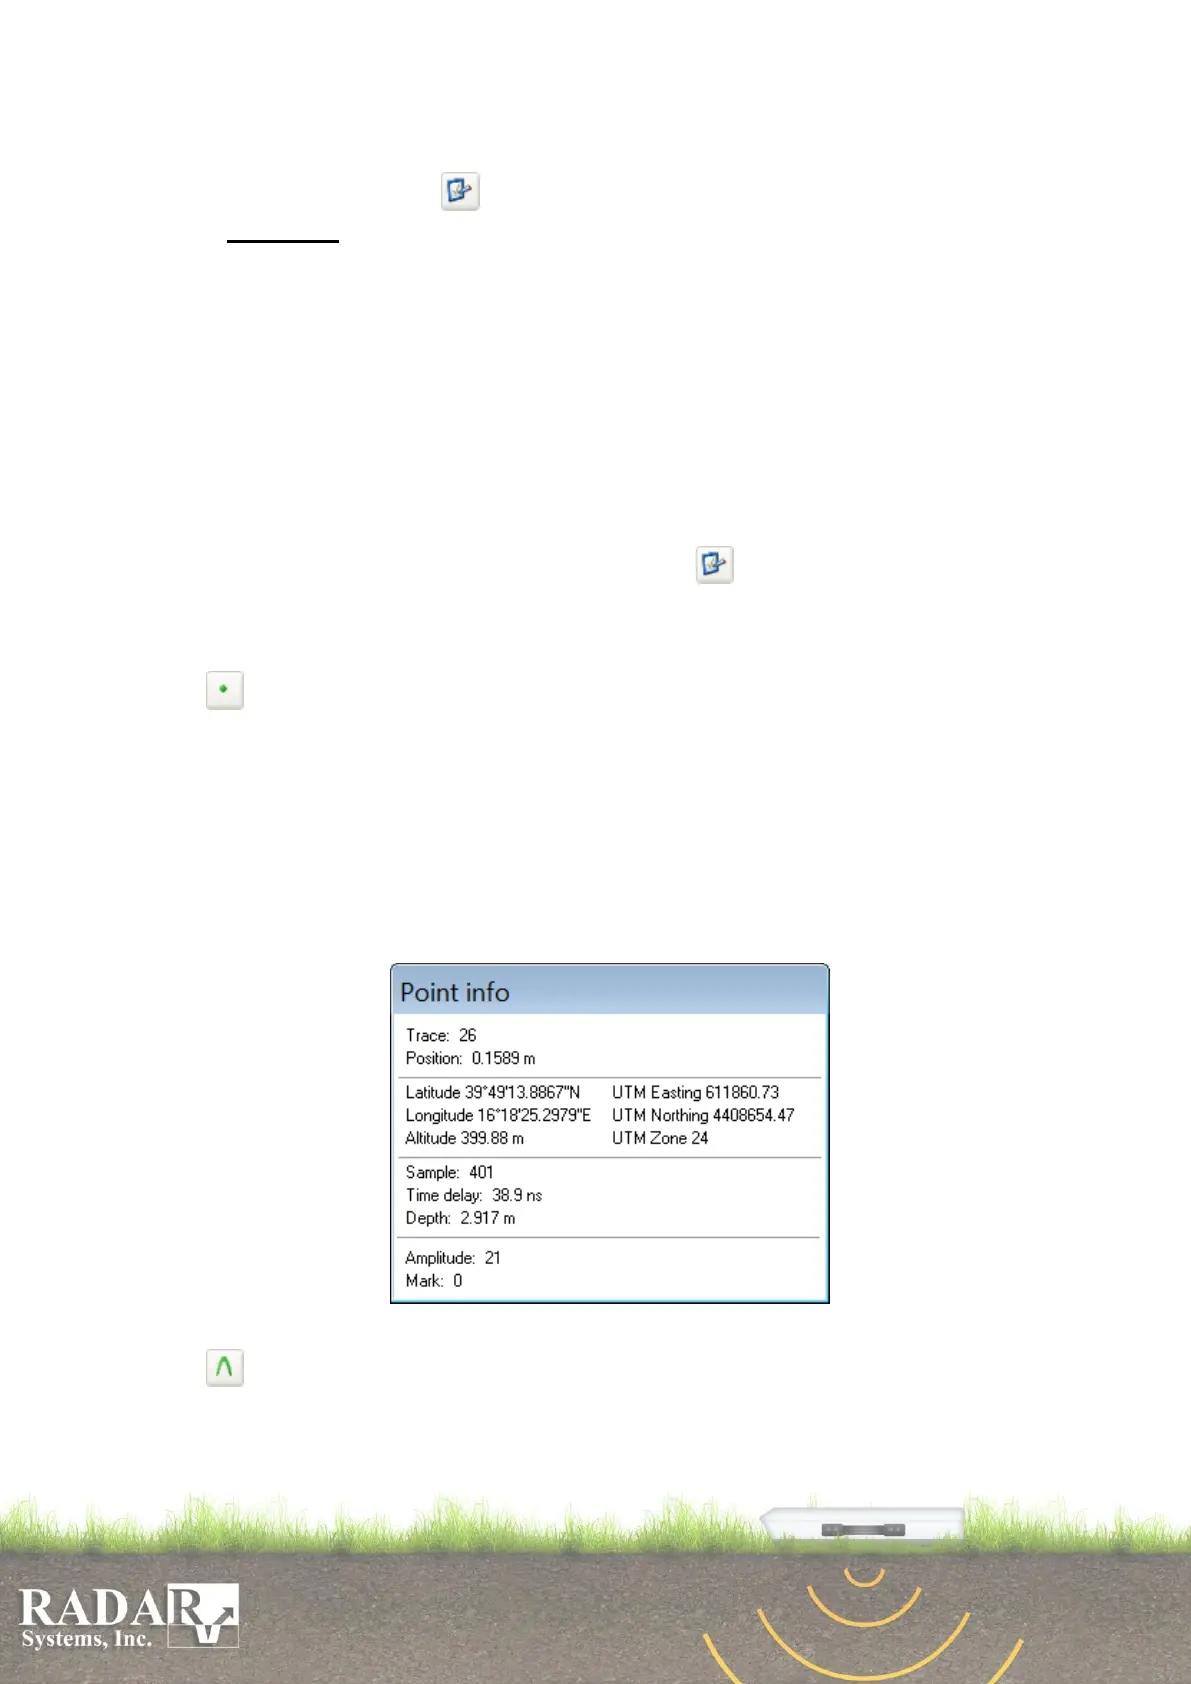
Point info – parameter values output: Trace number, Position, Sample number,
Time delay, Depth, specified profile’s point Amplitude, Latitude, Longitude and
Altitude as well as UTM Northing, Easting and Zone. If there is a mark its number will
be displayed in the bottom line of the dialog box. After activating Point info option
simply press anywhere on the profile where you need to know those parameters.
Holding left mouse button pressed will display a Point Info window illustrated in Fig.
10.2. Some of the information (trace number or position, sample number or time delay
or depth, latitude, longitude, altitude) is constantly displayed in the status bar located at
the bottom of the main window while you move your cursor along the profile.
Fig. 10.2. Point Info output dialog box.
Hyperbola – Local object’s depth and medium’s permittivity determination.
When a profile intersects diffractive targets, such as pipes, cables, stones, archeological
objects, areas of drastic soil properties variation, their signals on the radiolocation
profiles have hyperbola shape; signal examples are shown in Figs. 4.2, 4.3, 10.3. When
Hyperbola option tool is selected, pressing on the profile will draw hyperbolic line that