6
4. Radiolocation Data Display Examples
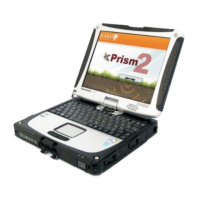
Fig. 4.1. Trace display example.
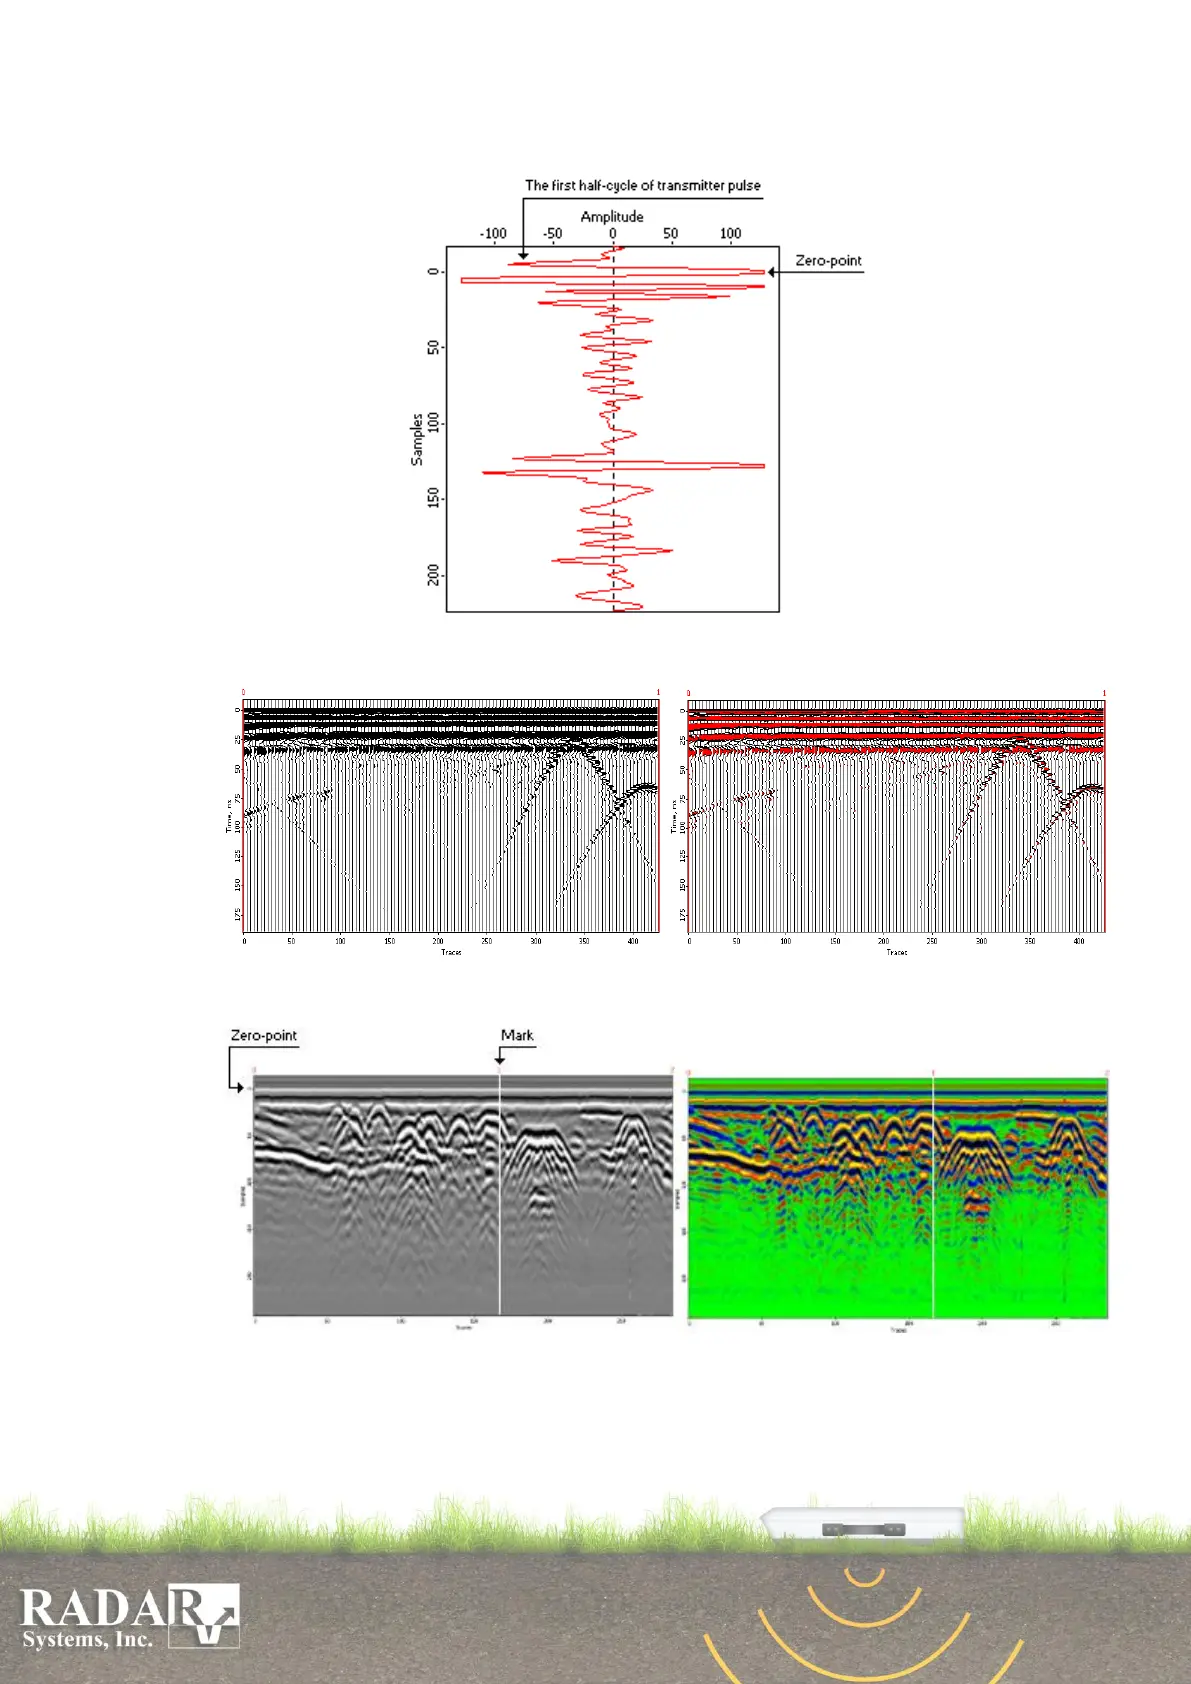
Fig. 4.2. Wiggle plot profile display example (black-and-white and color scales).
Fig.4.3 Density profile display example (black-and-white and color scales).
Note: Our experience shows that usually the most informative sounding data display type
is the density profile in the black-and-white scale (see Fig. 4.3, left side).