34
the window. There is an additional information output in the right top corner, what
describes the maximum of spectrum function and calculated bandwidths on different
levels: 0.707 (-3 dB), 0.5 (-6 dB) and 0.25 (-12 dB). Please note, that information output
format depends on the size of spectrum window and part of spectrum which is zoomed
in it. Scrollbar appears after zooming and could be used for scrolling of zoomed
spectrum.
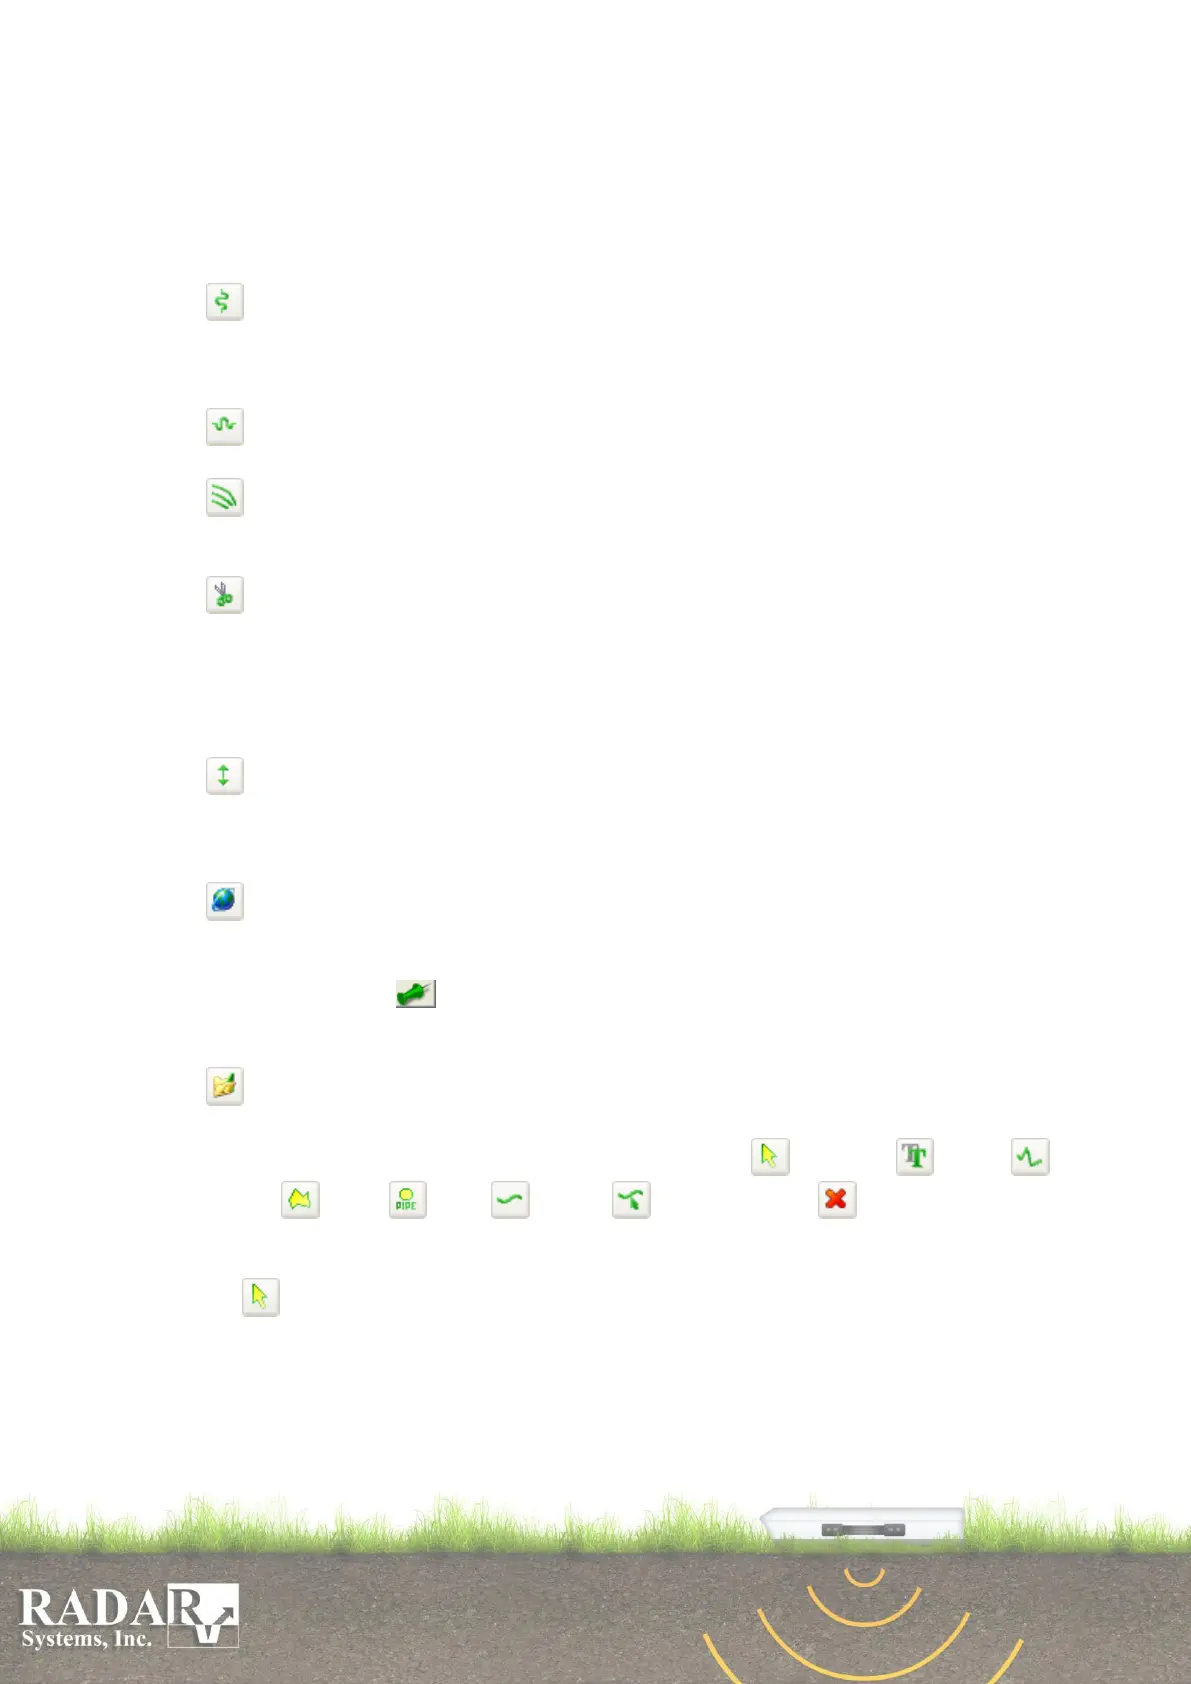
Trace inspection – trace wave output in a separate window. Click the left mouse
button at the desired place; vertical line with a crosshair will appear on the profile,
indicating trace position. You can also navigate along the profile by pressing or
keys, changing the desired trace.
Sample inspection – samples wave output along the profile. You can navigate
along the vertical scale by pressing or keys, changing the desired sample number.
Hodograph – layer-by-layer ground thickness values and permittivity calculation
using the common depth point method within a flat layer model. See Section 14 for
more details.
Cut – traces and samples cutting out from the profile. Press and hold the left
mouse button, then move your mouse horizontally to select undesirable traces, or move
vertically for samples. Dialog window will appear, after the mouse button releasing,
allowing you to correct initial and final trace or sample ranges for cutting out. Cutting
could be applied to the current opened profile or to all opened profiles by pressing on a
corresponding button - Apply or Apply To All.
Pulse delay adjustment – profile time axis position adjustment. Moving the
mouse while pressing and holding left mouse button will move time axis line to your
desired position on vertical axis. Releasing left mouse button will move profile to the
new position according to the new first lobe of the sounding signal.
GPS Tracker – opens GPS tracker window, which displays profiles paths based
on recorded coordinates of opened profiles (if one or several profiles haven't
coordinates, nothing would be drawn). Blue and red rectangles indicate start and stop
points. Pin button moves GPS tracker window to the left bottom corner and
allows you to view the trace’s coordinate, corresponding to the mouse cursor position
on the drawn path (small green rectangle with trace coordinates information).
Annotations – creating, deleting and editing annotations on a profile. Software
switches operation mode to the annotation mode, after this button pressing, and eight
Annotation Toolbar comprising buttons will appear: Pointer, Text,
Lines, Area, Pipe, Picket, Edit picket and Close. Annotations
are saved in a separate file with .ann extension, under the same file name as the data
file.
o Pointer – allows working with annotation objects: moving text, moving line
vertexes, deleting objects, and changing their properties. To move the objects or
vertexes select them by pointing your cursor under the object, so they will change
their color, press and hold left mouse button and move the cursor at the new place.
If you select an item and press the right mouse button, it open a drop-down menu
with appropriate list of options, like Delete or Delete vertex for an example.