21
To cancel data hold, press
DATA-H
again or move the se-
lector.
USING THE BAR GRAPH
The meter also indicates all the measurements on the
bar graph at the bottom of the display. The bar graph’s
length increases and decreases with the measured val-
ue. You can easily observe changes in measurements by
watching the bar graph.
Exam
le
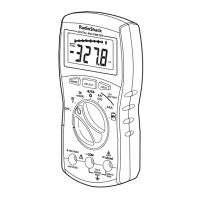
: If the meter measures 12V in the 300V range,
the display shows:
(illustration)
22-178.fm Page 21 Friday, August 6, 1999 11:38 AM
 Loading...