Basic Operations
R&S
®
ESR
51Getting Started 1316.3749.02 ─ 09
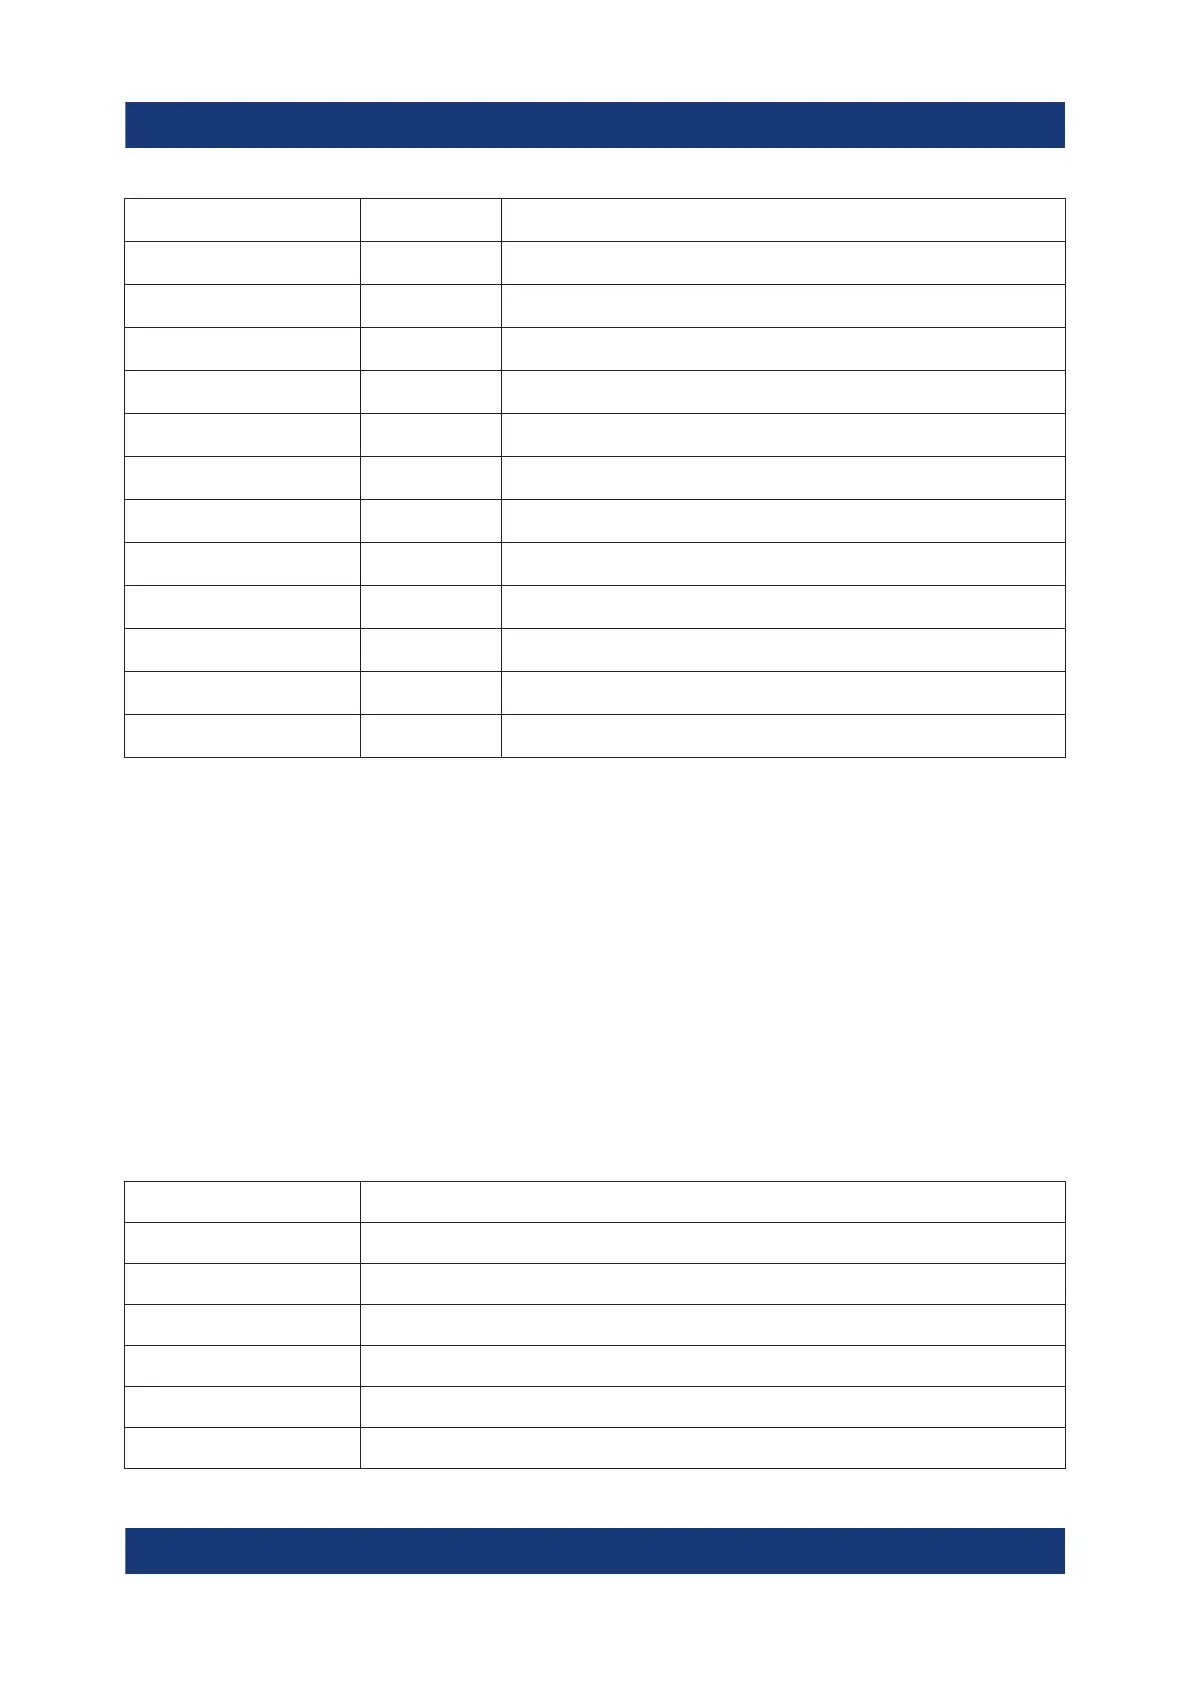
Sa SAMPLE detector
Av AVERAGE detector
Rm RMS detector
QP QUASIPEAK detector
CA CISPR Average detector
RA RMS Average detector
Trace Mode
Sweep mode:
Clrw CLEAR/WRITE
Max MAX HOLD
Min MIN HOLD
Avg AVERAGE (Lin/Log/Pwr)
View VIEW
Marker information in Diagram Grid
The x and y axis positions of the last 2 markers or delta markers that were set, as
well as their index, are displayed within the diagram grid, if available. The value in
the square brackets after the index indicates the trace to which the marker is
assigned. (Example: M1[1] defines marker 1 on trace 1.) For more than 2 mark-
ers, a separate marker table is displayed beneath the diagram.
The marker function information is not available in realtime mode.
If applicable, the active measurement function for the marker and its main results
are indicated, as well. The functions are indicated with the following abbrevia-
tions:
FXD Reference fixed marker active
PHNoise Phase noise measurement active
CNT Frequency counter active
TRK Signal track active
NOIse Noise measurement active
MDepth Measurement of the AM modulation depth active
TOI TOI measurement active
Information in the Diagram Area

 Loading...

