5
CONTENTS
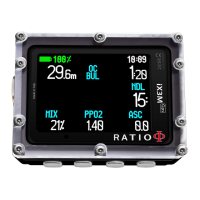
The RATIO iX3M when diving
Dive Screen 48
Main Data 48
Current dive’s profile: 51
Tissues saturation when diving:
The diagram represents the 16 tissues which are
taken into consideration by the two decompressive
algorithms (BUL or VPM). 51
The yellow lines represent the nitrogen levels .
The green lines represent the helium levels (if pre-
sent) 51
Decompression Chart: 52
Compass when diving 53
Applications when diving 54
Mix change during the dive 55
Setting change during the dive 56
The iX3M in GAUGE mode