59
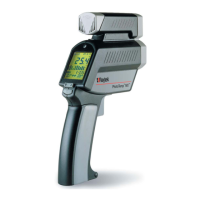
The graphic display (A) shows the
temperature as a picture. The last ten
measurements are shown (B). It is
possible to choose between Auto
Range and Manual Range. In manual
range the user defines the beginning
and ending temperature points of the
graph.
Der grafische Teil (A) des Displays
stellt die 10 zuletzt gemessenen Werte
als Trendanzeige dar. Der Meßbereich
einer Säule (B) kann automatisch
vom Gerät berechnet (Auto Range
Funktion) oder von Ihnen eingestellt
werden (Man. Range Funktion).
La zone graphique (A) de lécran
représente les dix dernières mesures
sous forme de bargraph. Léchelle
peut en être définie automatiquement
ou manuellement.
DISPLAY
GRAPHIC
DISPLAY
DISPLAY
GRAPHIK-
BEREICH
La pantalla gráfica (A) muestra la temperatura
como una imagen. La gráfica representa las
últimas 10 lecturas (B). Es posible seleccionar
entre Auto Rango y Rango Manual. En
Rango Manual el usuario define el punto
inicial y final de la gráfica.
AFFICHAGE
AFFICHAGE
GRAPHIQUE
PANTALLA
CAMPO GRÁFICO
A parte gráfica (A) do mostrador indica os
últimos 10 valores medidos em
forma de barras. Os limites de medição
das barras (B) podem ser reguladas
automaticamente ou ajustadas manualmente.
No range manual o usuário
define o início e o fim dos pontos de
temperatura no gráfico.
MOSTRADOR
QUADRO GRÁFICO
 Loading...
