Pantone 534 Blue
Pantone 123 Yellow
Pantone 485 Red
Pantone 123 Yellow
Pantone 534 Blue
Black
Rich Black -
20/20/20/100
Blue - 100/80/30/5
Yellow - 0/27/100/0
Red - 10/100/100/5
Yellow - 0/27/100/0
Blue - 100/80/30/5
Only if you REALLY need them:
Pantone 534 Blue - 100/80/30/5
Pantone 485 Red - 10/100/100/5
Pantone 123 Yellow - 0/27/100/
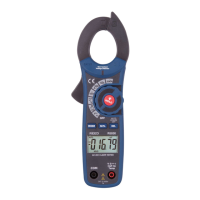
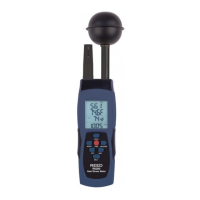
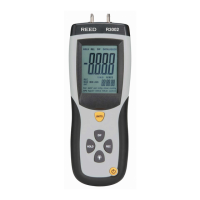
INSTRUMENTS
Quick Start Guide
Recording Real Time Data in Waveform
1. Turn the meter on and connect it to a PC.
2. Open the Data Logging Software.
3. If the connection was successful the computer will display the
same value as the meter. If it fails to connect the PC will display
“No Connection”.
4. When the connection is successful, click on the Play Button to
start recording real-time data The graph will display a waveform.
5. Click on the Stop Button to stop recording.
Save Recorded Data
1. Click on the graph window you want to save, making it the Active
Graph.
2. Select “File > Save” from the Main Menu, or click on the Diskette
Icon from the Tool Bar.
3. A Save Dialog Window will appear for you to name and choose
the le type.
4. There are three le types to choose from: Binary (*.ghf), Text Tab
Delimited (*.txt), and Comma Delimited (*.csv). The Binary les
take less disk space, but can only be used in the Data Logging
Software. The Text Tab Delimited le has the data separated
by tabs and can be opened by a word processer program. The
Comma Delimited le has the data separated by commas and can
be opened by Excel only.
1.888.475.5235info@REED-Direct.com
REED-Direct.com
 Loading...