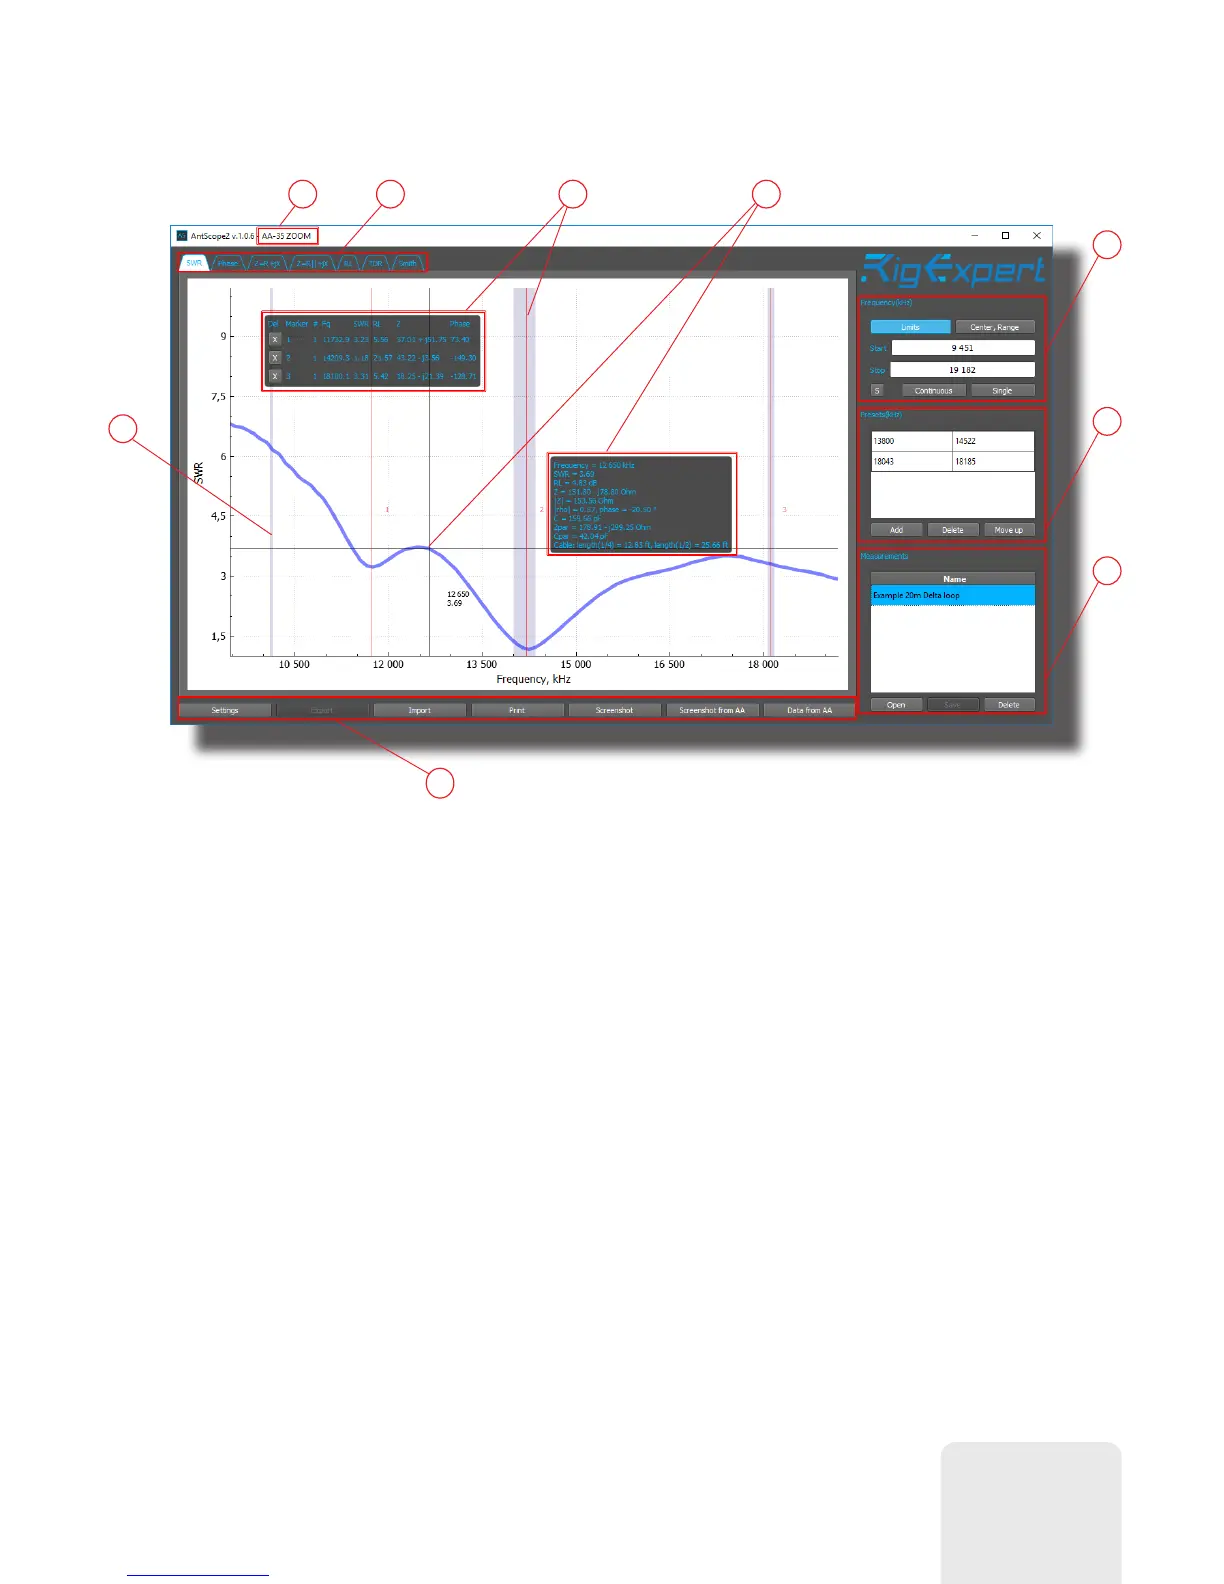
The screen shot below shows a typical AntScope2 screen:
1
2 3 4
6
7
8
9
1. Window header. Connected analyzer model is shown here.
2. Charts type selection tab.
3. Markers and markers information window.
4. Mouse cursor position and detailed parameters window.
5. HAM radio bands markup.
6. Analyzer measurement controls. Active only while analyzer is connected.
7. Presets list for quick measurements.
8. List of displayed measuremens. You can display several graphs simultaneously.
9. Toolbar.
5
7
 Loading...