Schweitzer Engineering Laboratories, Inc. SEL-787-2, -3, -4 Data Sheet
19
disconnects, and 2 controllable 3-position disconnects.
ANSI and IEC symbols, along with analog and digital
labels, are available for you to create detailed SLDs of
the bay to indicate the status of the breaker and discon-
nects, bus voltages, and power flow through the breaker.
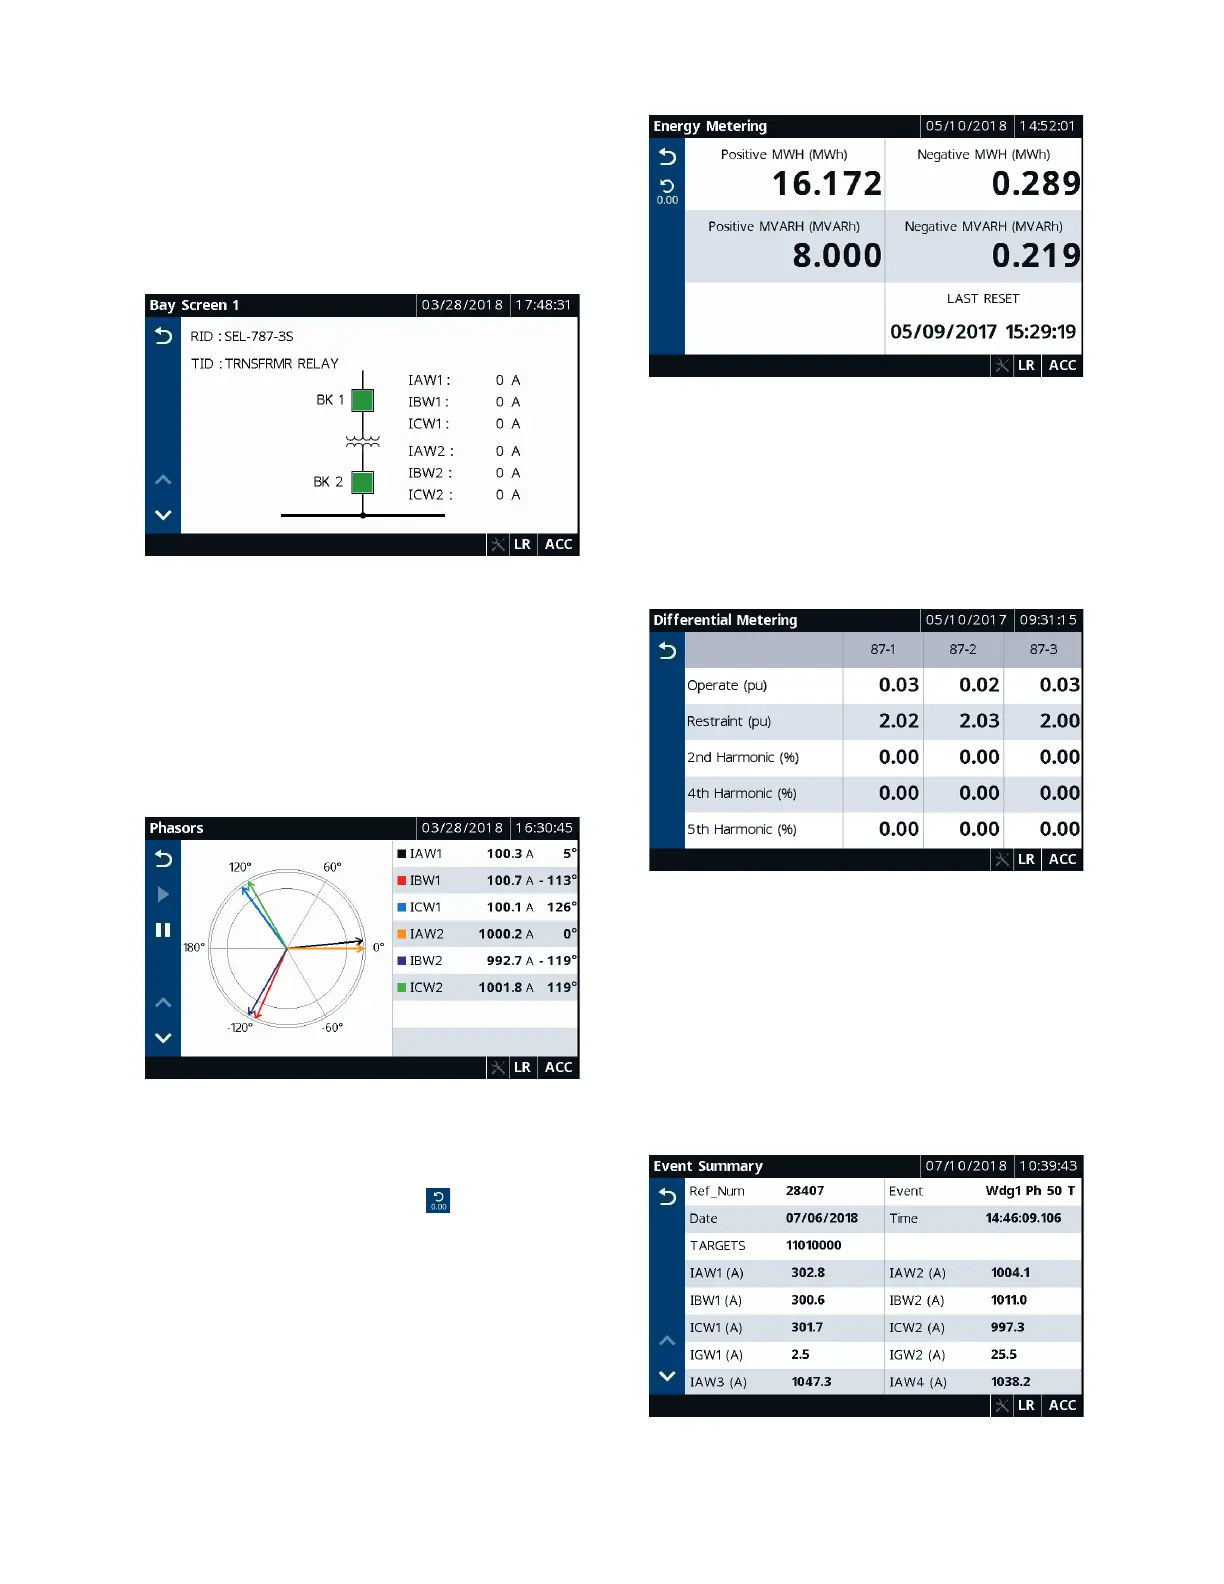
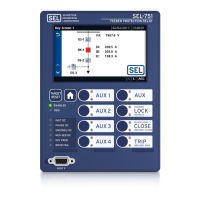
Figure 21 shows the default SLD for the touchscreen dis-
play option.
Figure 21 Default Bay Screen
Meter Folder Applications
The applications in the Meter folder are part-number
dependent. Only those metering applications specific to
your part number appear in the Meter folder. Tapping an
application in the Meter folder shows you the report for
that particular application. Tap the Phasor application to
view the current and voltage phasors (see Figure 22).
Figure 22 Meter Phasors
Tap the Energy application to view the energy metering
quantities (see Figure 23). A reset feature is provided for
the Energy, Max/Min, Demand, and Peak Demand
applications. Tap the Reset button (see Figure 23) to
navigate to the reset confirmation screen. Once you
confirm the reset, the data are reset to zero.
Figure 23 Meter Energy
Tap the Differential application to view the operate and
restraint currents for each differential element (87) of
your transformer in multiples of TAP. Use these
quantities in conjunction with the phasors or
fundamental metering screen to visualize the differential
protection of your transformer and for commissioning
exercises.
Figure 24 Meter Differential
Reports Folder Applications
Tapping the Reports folder navigates you to the screen
where you can access the Events and SER applications.
Use these applications to view events and SERs. To view
the event summary (see Figure 25) of a particular event
record, tap the event record on the Event History screen.
You can also trigger an event from the Event History
screen.
Figure 25 Event Summary