11
signal trace will be displayed.
This procedure can catch occasional events very easily, such as. a sudden spike of high amplitude. Set
the trigger level a little bit higher than normal signal level, press
, and wait for the spike. DSO203
will automatically trigger and store the waveforms before and after the triggering event. It’s shown in
the figure below. You can observe the waveforms before and after the triggering event.
Example Three: Measurements with Cursors
There are several measuring cursors in DSO203. They are displayed a narrow dotted horizontal and
vertical lines across the display screen. They are used to measure the time and voltage in the signal
traces.
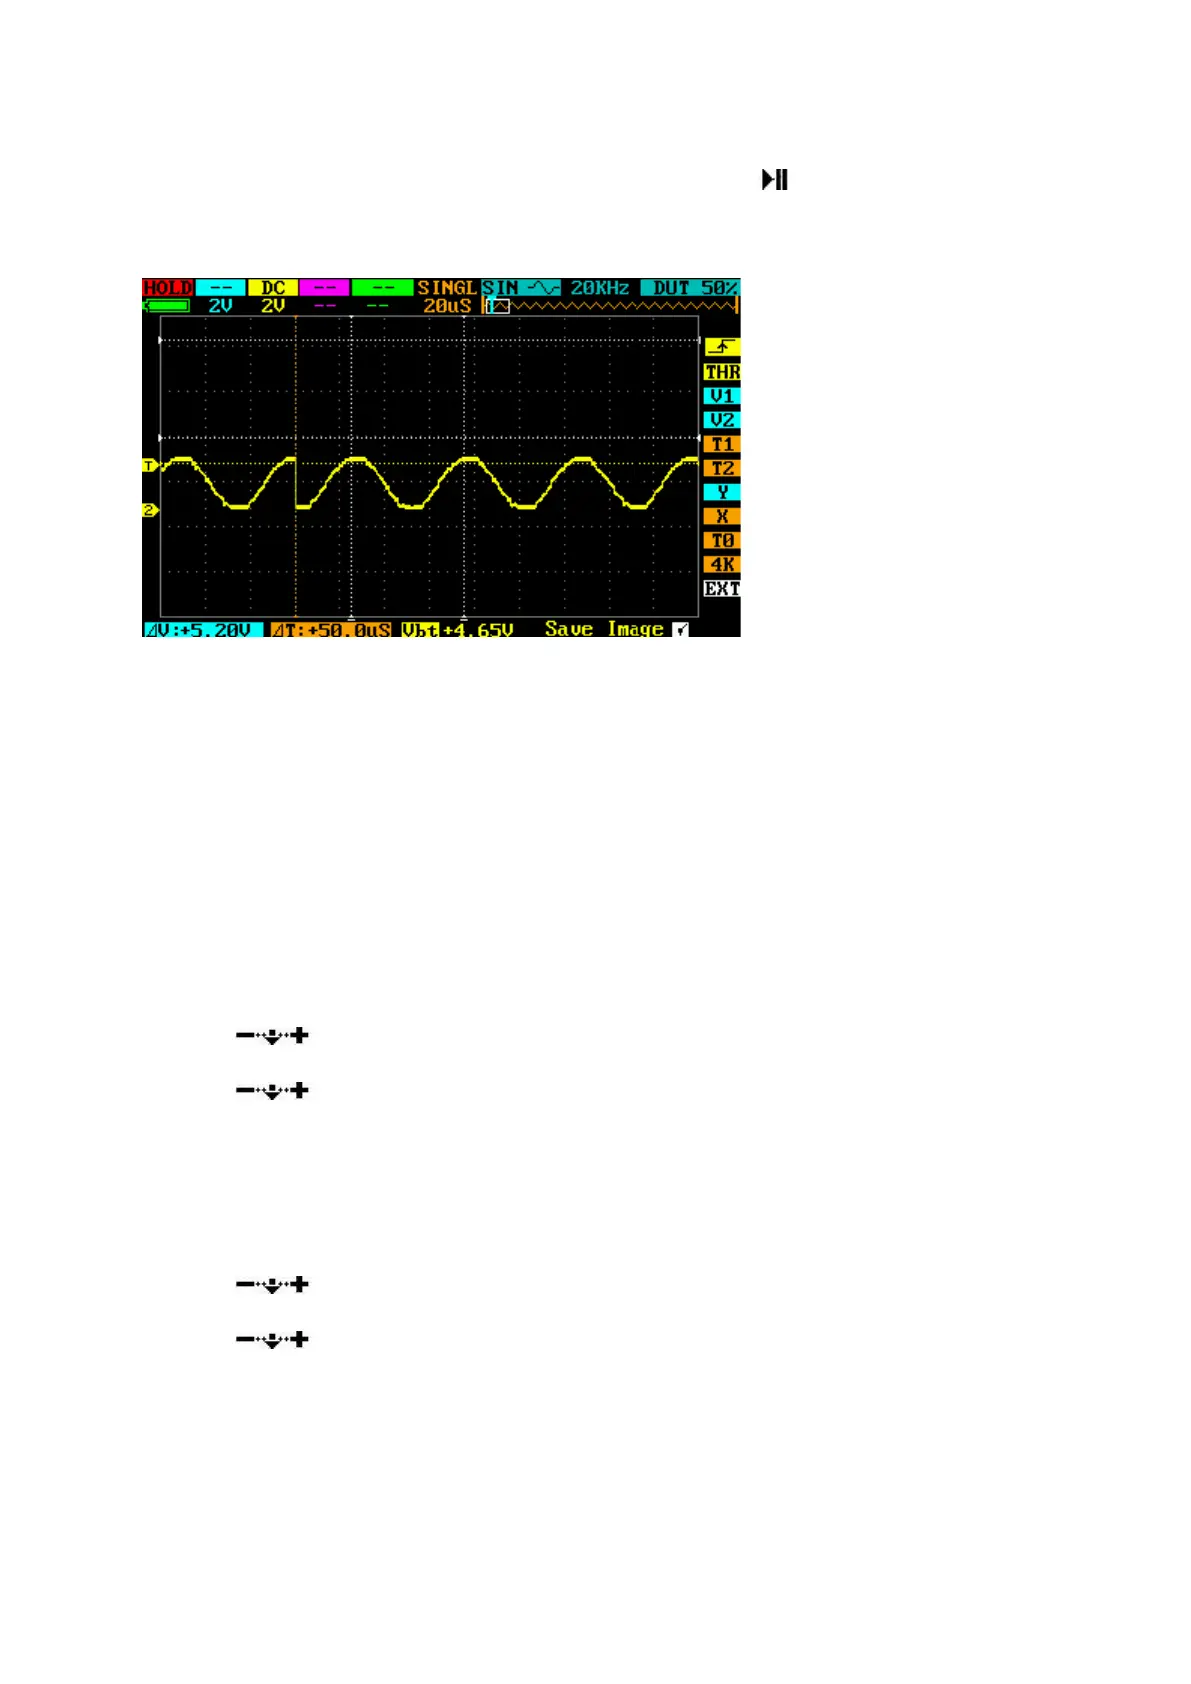
The following figure shows a typical analog signal trace. You can do two exercises with this trace.
Measure the cycle time of the 3rd waveform from the signal trace.
Follow these steps:
1. Navigate to T1 in N field. Change its color to yellow.
2. Scroll
, move cursor T1 to the 3rd peak of the trace.
3. Navigate to T2 in O field. Change its color to yellow.
4. Scroll
, move cursor T2 to the 4th peak of the trace.
5. Read △T=14.0uS, in the W field of the Parameter Area.
Measure the peak-to-peak voltage of the signal trace.
Follow these steps:
1. Navigate to V1 in L field. Change its color to yellow.
2. Scroll
, move cursor V1 to the top of the trace.
3. Navigate to V2 in O field. Change its color to yellow.
4. Scroll
, move cursor V2 to the bottom of the trace.
5. Read △V=168mV in the X field of the Parameter Area.