<
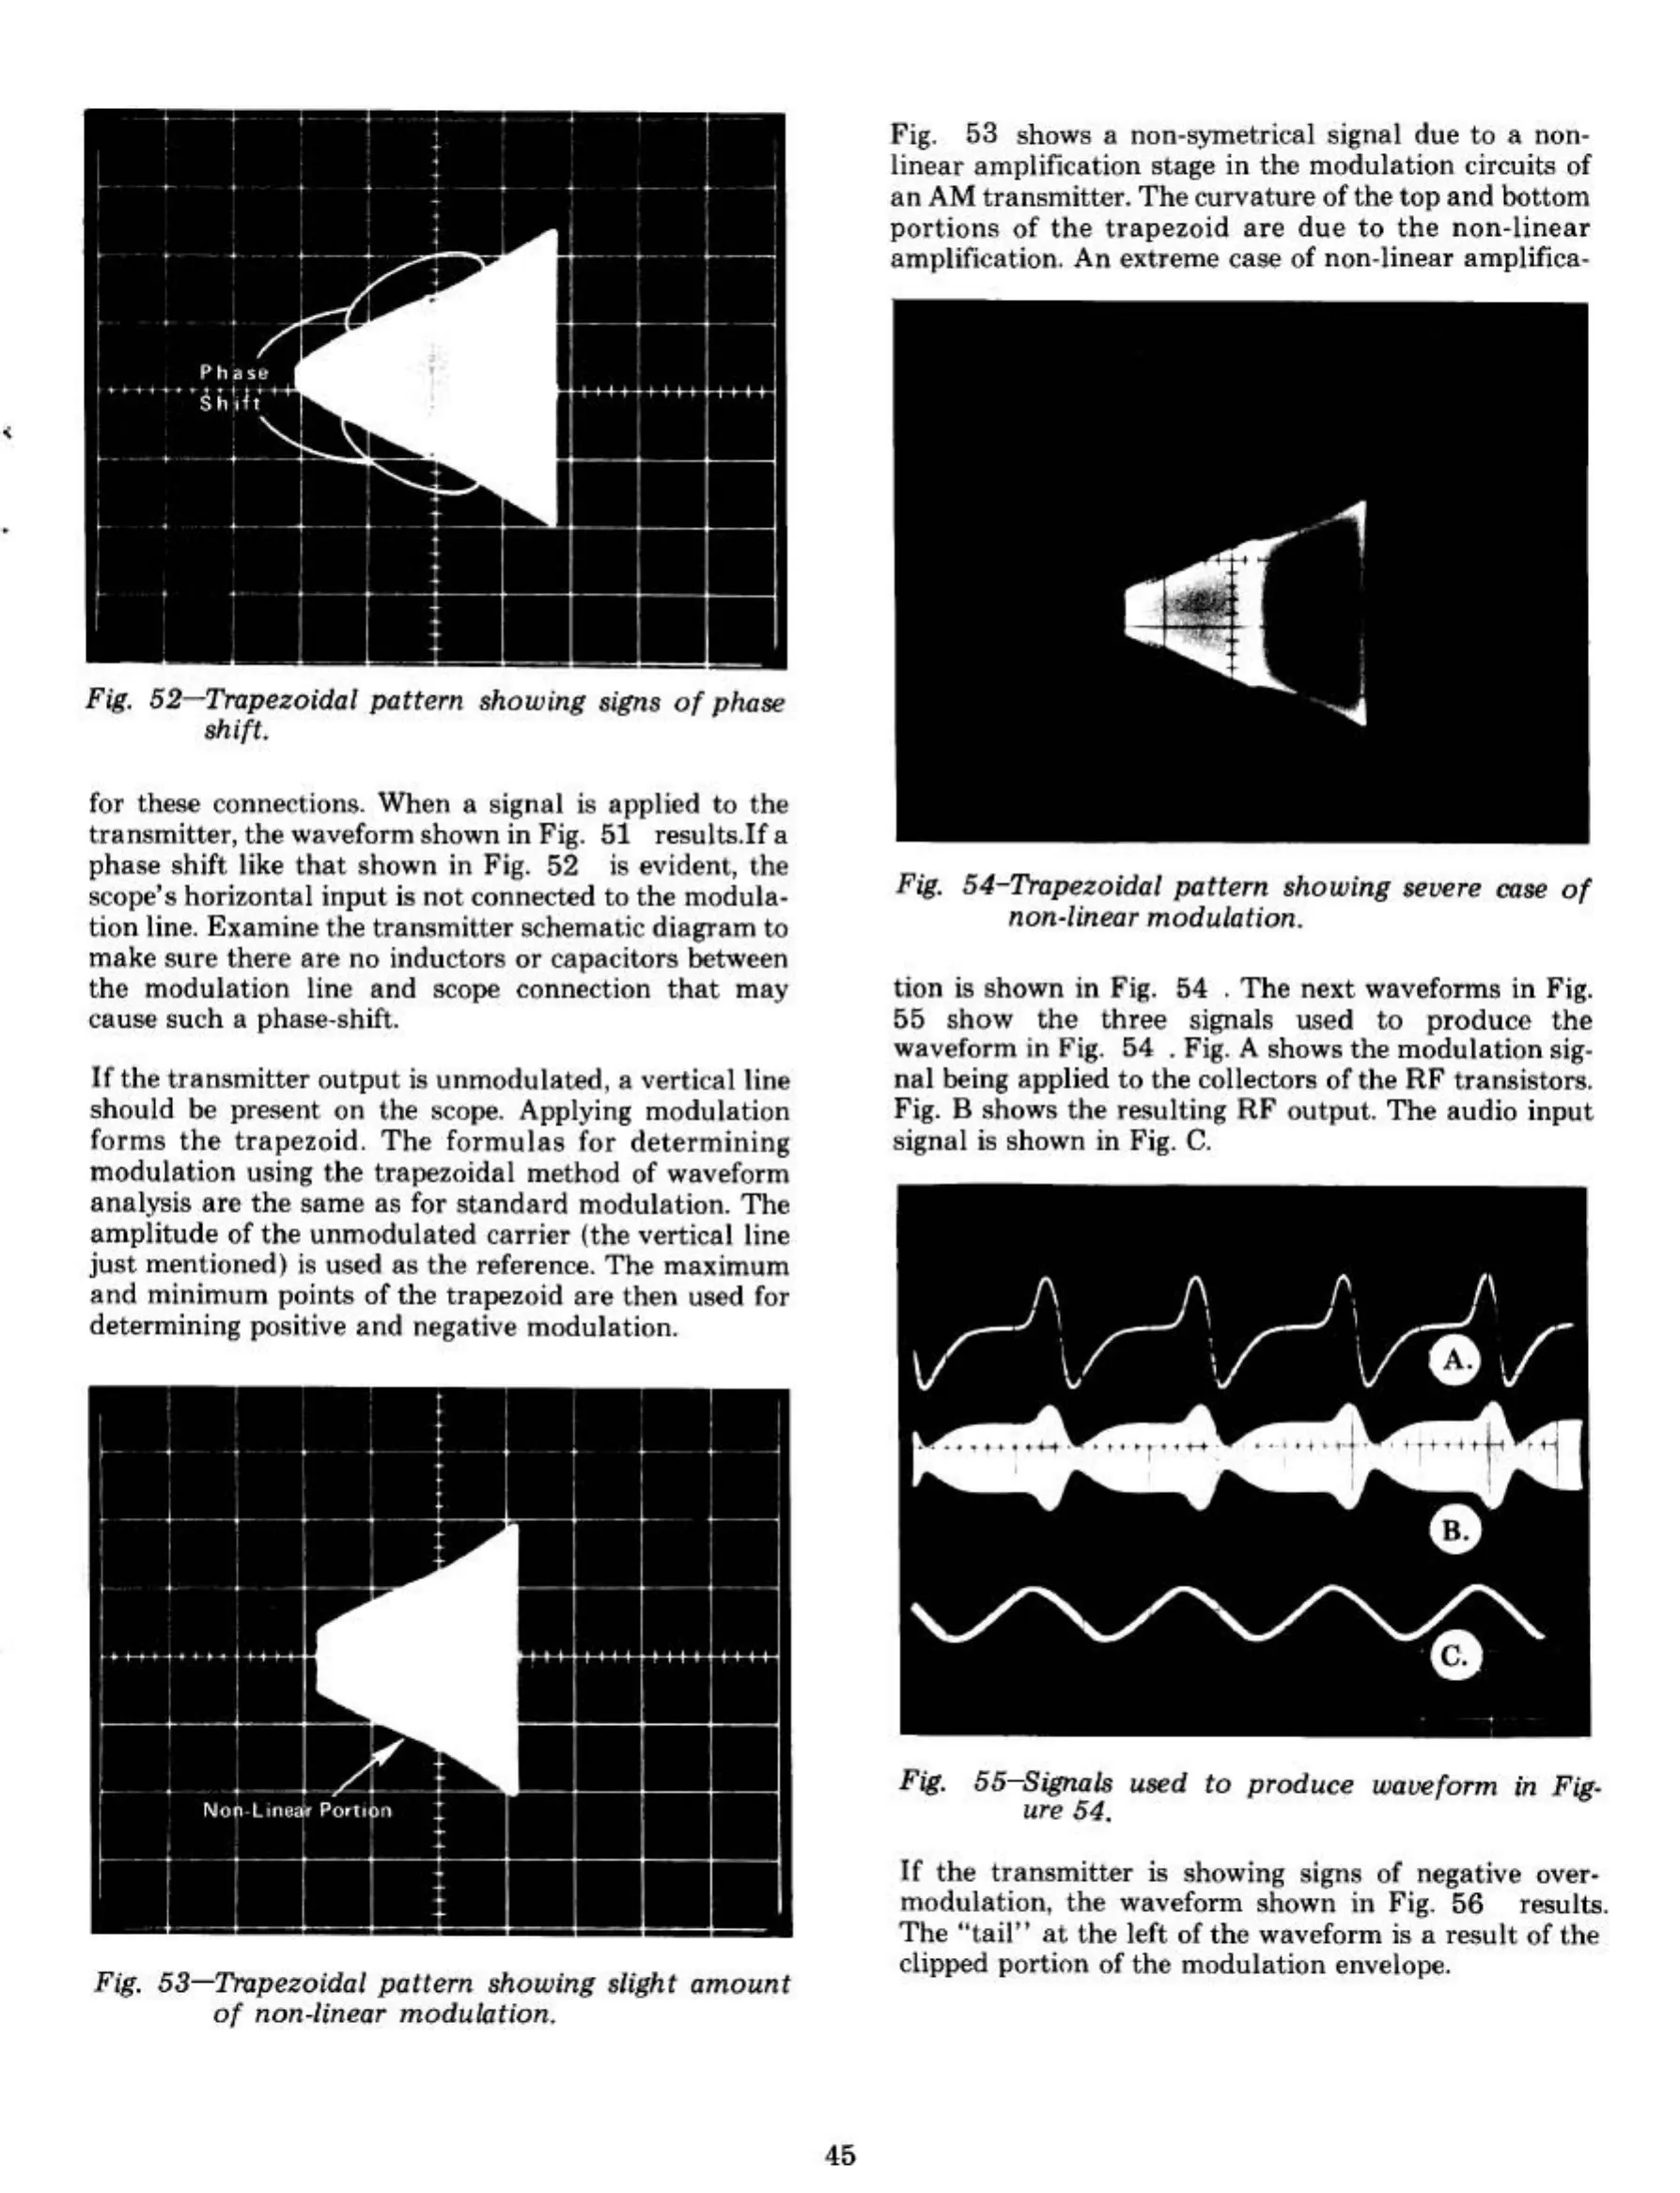
Fig.
62-Trape~oidal
pattern
Mowing
lSilf11lS
of
pholle
8/1;[1.
for
t~
oonne<:tiOM.
When
a signal ill applied to
the
transmitter,
the
wavefonn
shown
in Fig. 51 resu]lo,Ifa
ph.""
/Shift
like
that
ahown in Fig. S2 is evident,
the
llCOpe'lS
horizontal input is not connected
to
the
modula.
tion line.
Examine
the
trllt>llmitler schematic
diagram
to
make sure there
are
no
inductors
or
capadtol'l'l between
the modulation line
Bnd
scope connection
that
may
cause
such
a pha"".shifL
If
the
transmitter
output
ill
unmodulated.
a vertical line
should
be
Prelent
on
the
scope. Applying
modulation
forms
the
trapezoid.
The
formulas
for determining
modulation using the
trapezoidal method of waveform
analysis
BTC
the
same as for
~lBndard
modulation. The
amplitude of
the
unmodulated csrrier \the vertical line
just
mention~1
is
used
as
the
reference,
The
muimUffi
and
minimum
poinu
of
the
trapezoid
are
then used for
determining
po>;itive
and
negati"e modulation.
Fig.
53-Trope2o!dal
paltem
lShowlng e/ight
amOunl
of
non·linear
modulotion.
45
Fig.
53
shows a non-symetrical signal due
to
a
nOn-
linear
amplification stage in
the
modulation
circuits
of
an
AM
transmitter.
The
curvature
of
the
top
and
bottom
portions
of
the
trapuoid
are
due
to
the
non-linear
amplifICation. An eXlreme
caaoe
of
non_linear amplifica_
Fig. 54-Tropll20!dcr/ perttem lShowing
Ullere
COile
of
non-linear
modultllion.
tion
is
shown
in
Fig. 54 .
The
Bext wavefornt5 in Fig.
1)5
shOw
the
three
signals used to
produce
the
waveform in t'ig. 54 . Fig. A
shoW'S
the
modulation
sig-
nal
being applied
to
the
""llactors
of
the
RF
transistor'll.
Fig.
B shows
the
resulting RF
output.
The
audio
input
signlll is shown in Fig.
C.
Fig. 5S-SigruJl8 uiled
to
produce waueform in
Fig_
ul'e 54.
If
the
transmitter
is showing signs
of
negative over_
modulation.
too
wavefonn
shown in Fig.
56
reoulto.
The
"tail"
at
the
left
of
the
waveform is a result
of
the
clipped
porti"n
of
the
modulation
envelope.