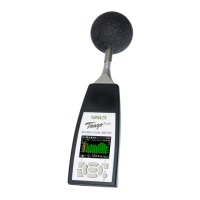
1.3 Design
tion, USB connection, Level of brightness. There are three basic modi to display spectra, history data or
numeric values:
Figure 1.4: Third Octave Display
The Third Octave Display shows a spectrum in
the main part with live values as bars and L
eq
values as roof top. Via left/right keys the spec-
tral cursor can be moved to select signle bands.
The band level and the frequency are displayed
above the graph as well as the measurement du-
ration. On the left L
AF
and L
CF
are displayed as
bars. The bottom shows numerically one sound
level value, which can be switched using the
up/down keys.
Figure 1.5: History Display
Instead of a spectrum the History Display shows
two level graphs in the main part. Which lev-
els are shown is set in the configuration (sec-
tion 2.2.2). The time length of the x-axis can be
toggled with the left/right keys.
Figure 1.6: Numeric Display
The Numeric Display shows the value of the lev-
els selected at the bottom.
SINUS Messtechnik GmbH 9 of 30 Manual Tango_Plus