QuickCollect CMDT 391 / CMDT 391-Ex 4 - 15
User Manual – Revision B
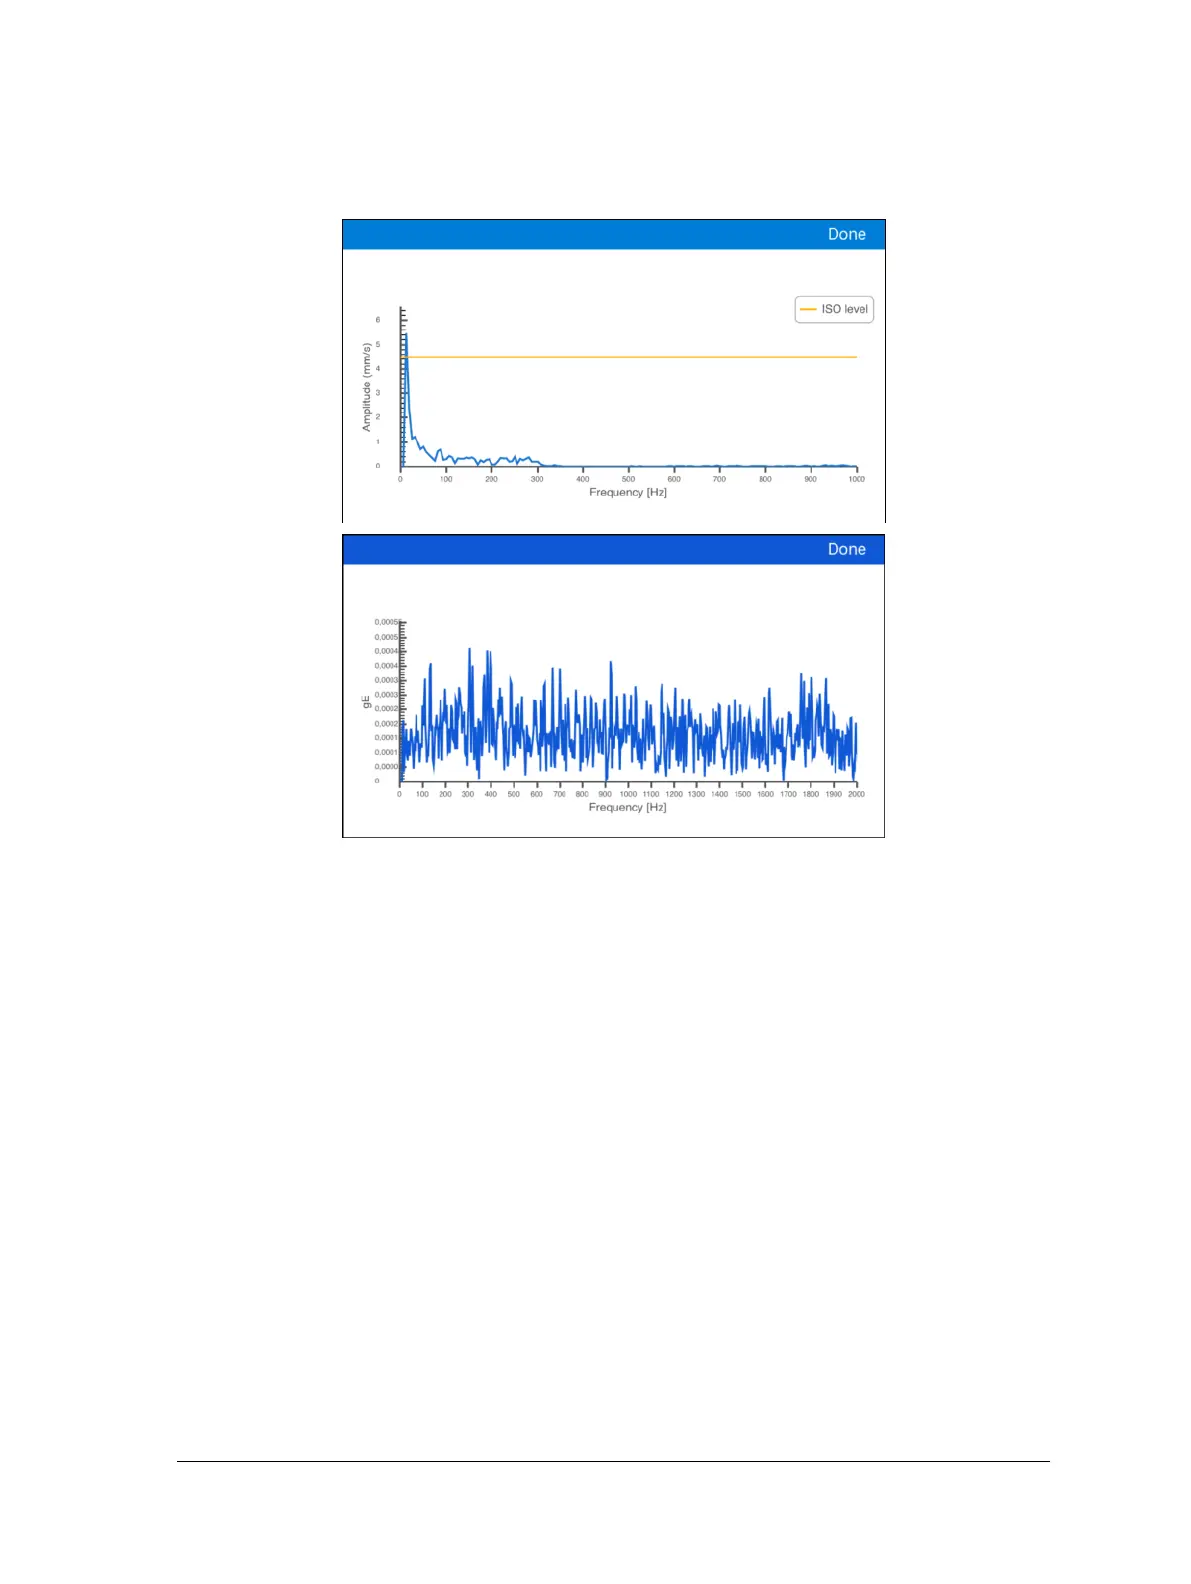
Tap the appropriate View Spectrum button. A plot screen will appear.
Figure 4 – 17.
Top: velocity spectrum. Bottom: acceleration enveloping spectrum.
Review the plot data and tap Done to return to the Measurement Results screen.
To return to Live Reading mode:
Tap Live Reading at the top of the Measurement Results screen. The home screen
will reload in Live Reading… mode.
Repeat all the above steps as necessary to configure, record and report velocity,
acceleration enveloping and temperature measurements.