38
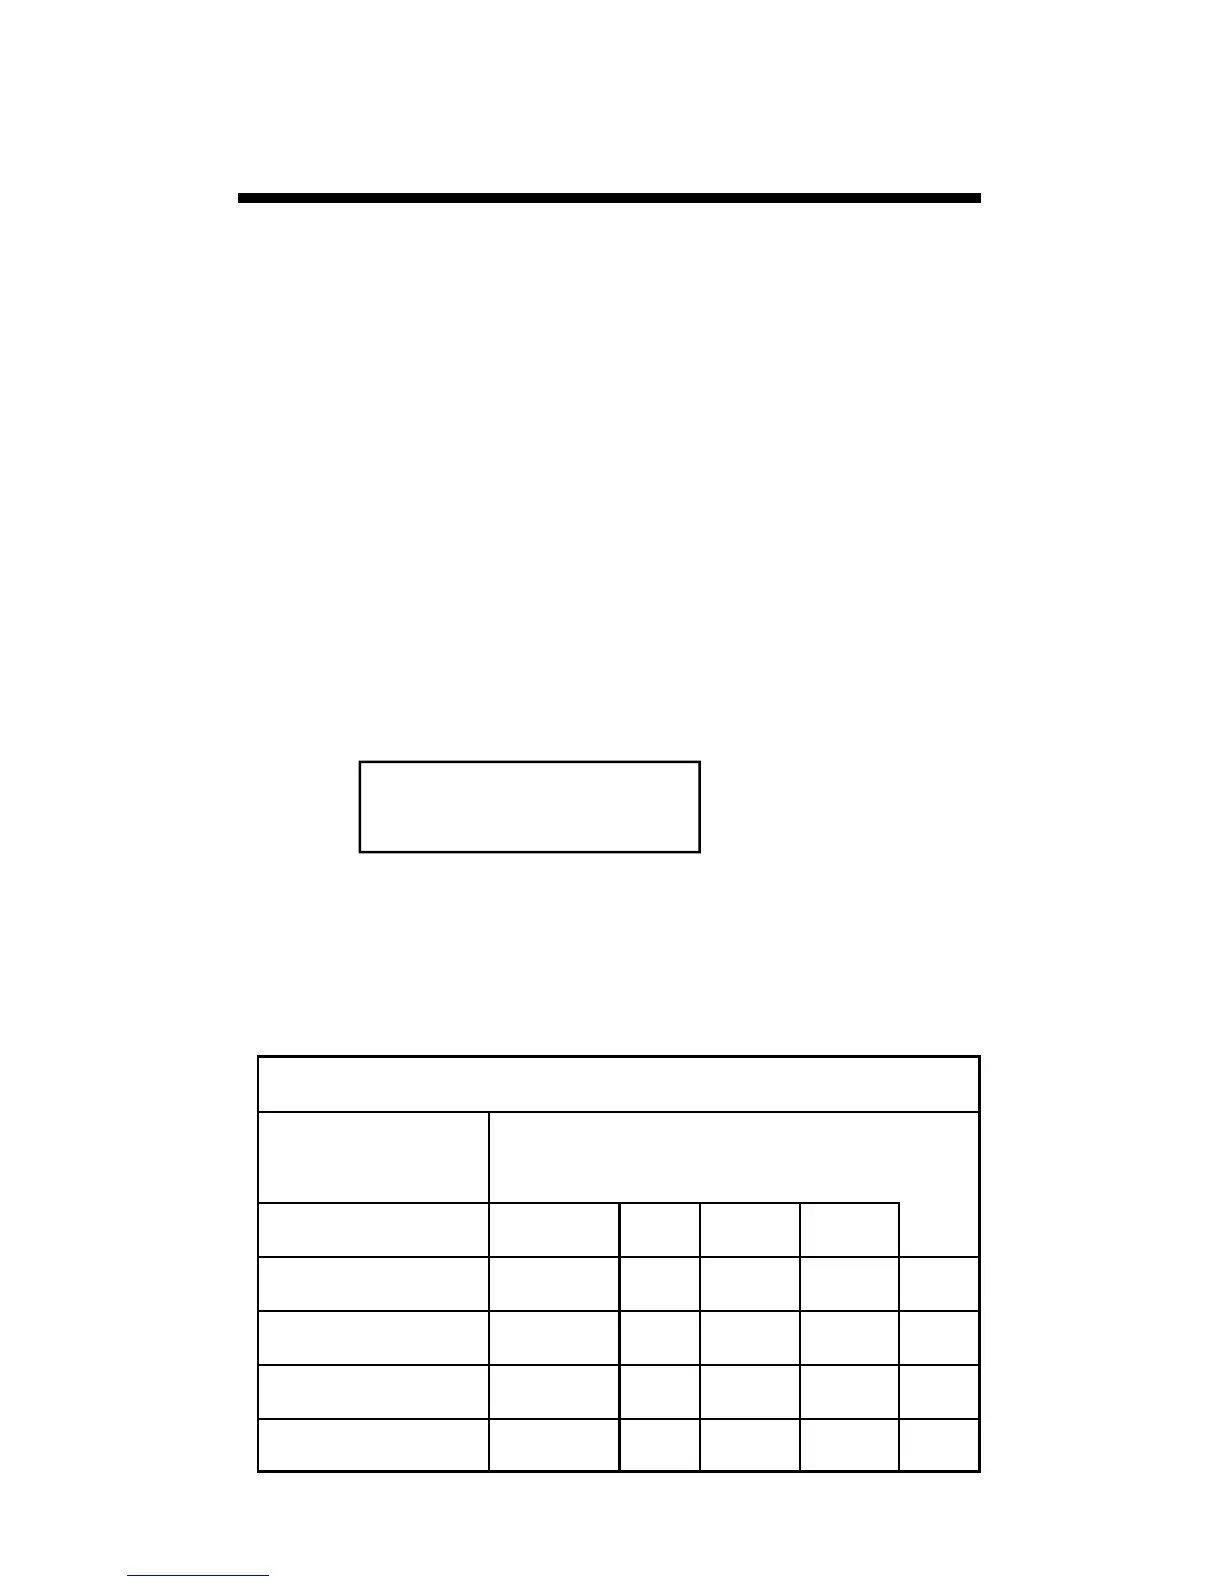
Average Temp
During Leaf Wet
Hours (ºF)
Hours of Leaf Wetness per Day
55-63 0-6 7-15 16-20 21 +
64-69 0-3 4-8 9-15 16-22 23+
70-78 0-2 3-5 6-12 13-20 21+
79-84 0-3 4-8 9-15 16-22 23+
Daily DSV = 0 1 2 3 4
Disease Severity Value Chart
This option uses Tom-Cast, a tomato disease forecasting
program designed to predict Early Blight, Septoria Leaf
Spot, and Anthracnose. (Pitblado ~1985; Bolkan and
Reinert 1994) Tom-Cast calculates a disease severity
value (DSV) to predict the development of these diseases.
An increasing number of leaf wetness hours and a higher
temperature cause the DSV to increase at a faster rate. A
Cumulative DSV of 15 to 20 is usually viewed as the
threshold for initiating a spray program. Contact your
State Agricultural Extension Service for further
information regarding disease management in your area.
Infection Severity Screen
TOMCAST DSV
DAY=2 ACCUM=010
Tom-Cast
This screen shows the DSV values for the day as well as
the accumulated DSV values. The daily DSV on this
screen is 2 and the number of DSV’s accumulated since
the reset is 10.
 Loading...