79
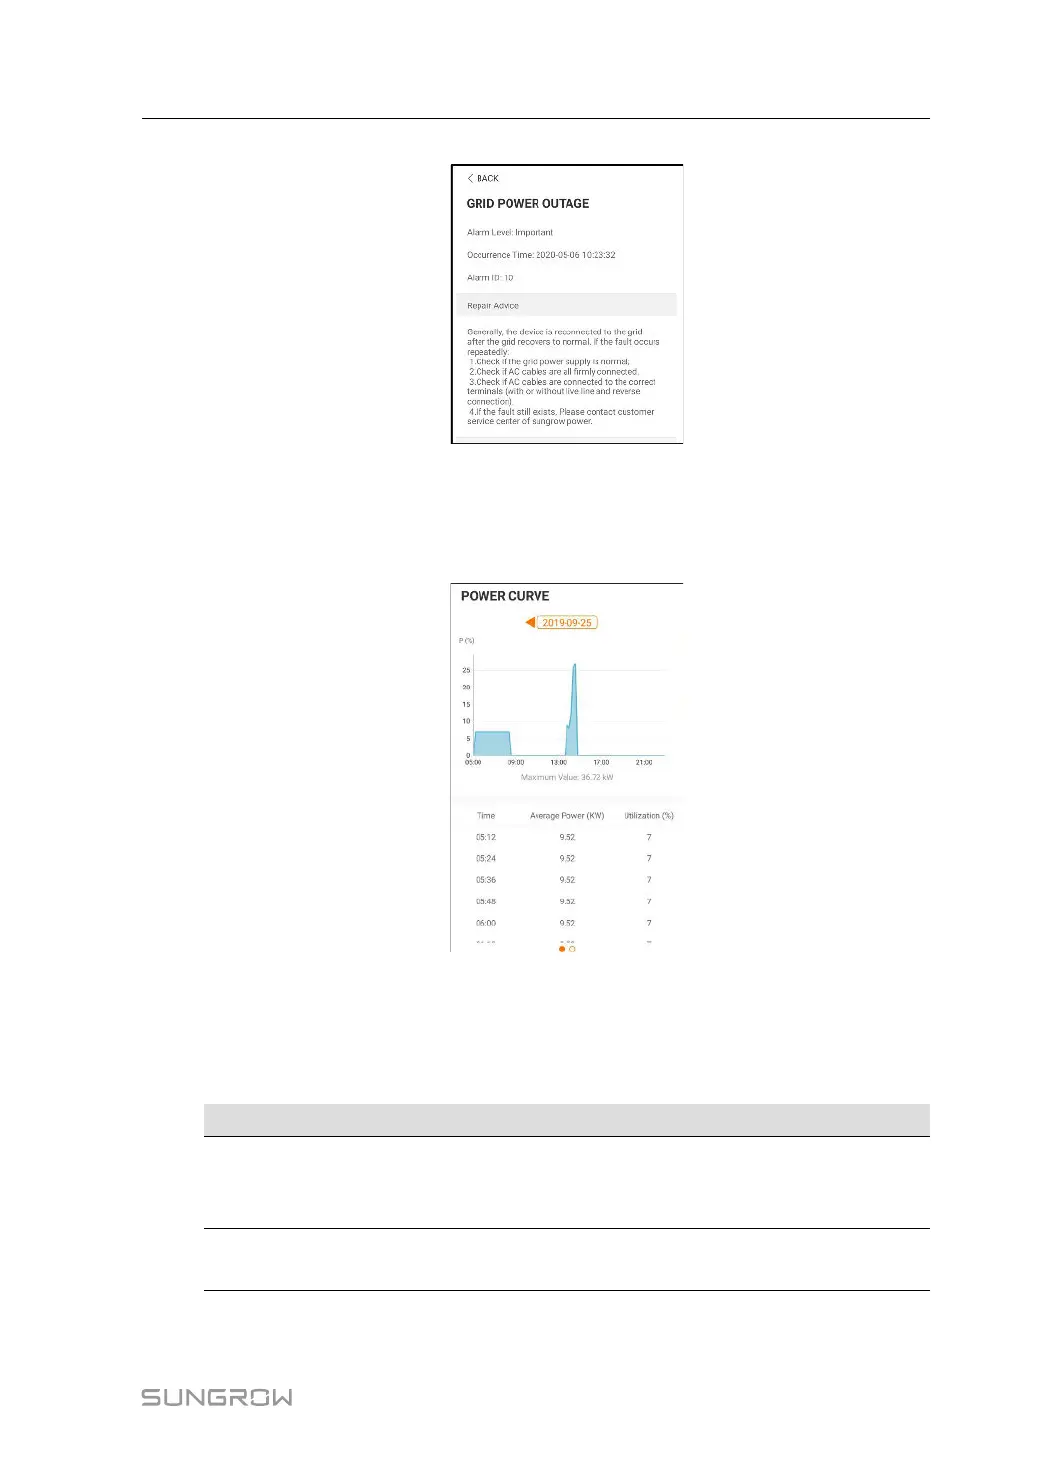
figure 7-9 Detailed Fault Alarm Information
Yield Record
Tap Yield Record to enter the interface showing daily power generation as shown in the fol-
lowing figure.
figure 7-10 Power Curve
The App displays power generation records in a variety of forms, including daily power gen-
eration graph, monthly power generation histogram, annual power generation histogram.
table 7-6 Yield Record Explanation
Parameter
Description
Power curve
Shows the power output from 5 am to 23 pm in a single day. Each
point on the curve represents the percentage of present inverter
power to rated power.
Daily yield
histogram
Shows the power output every day in the present month.
User Manual 7 iSolarCloud App
 Loading...