10 Quick Guide NanoQuant Plate
TM
No.30035094 Rev No. 1.4 2013-06
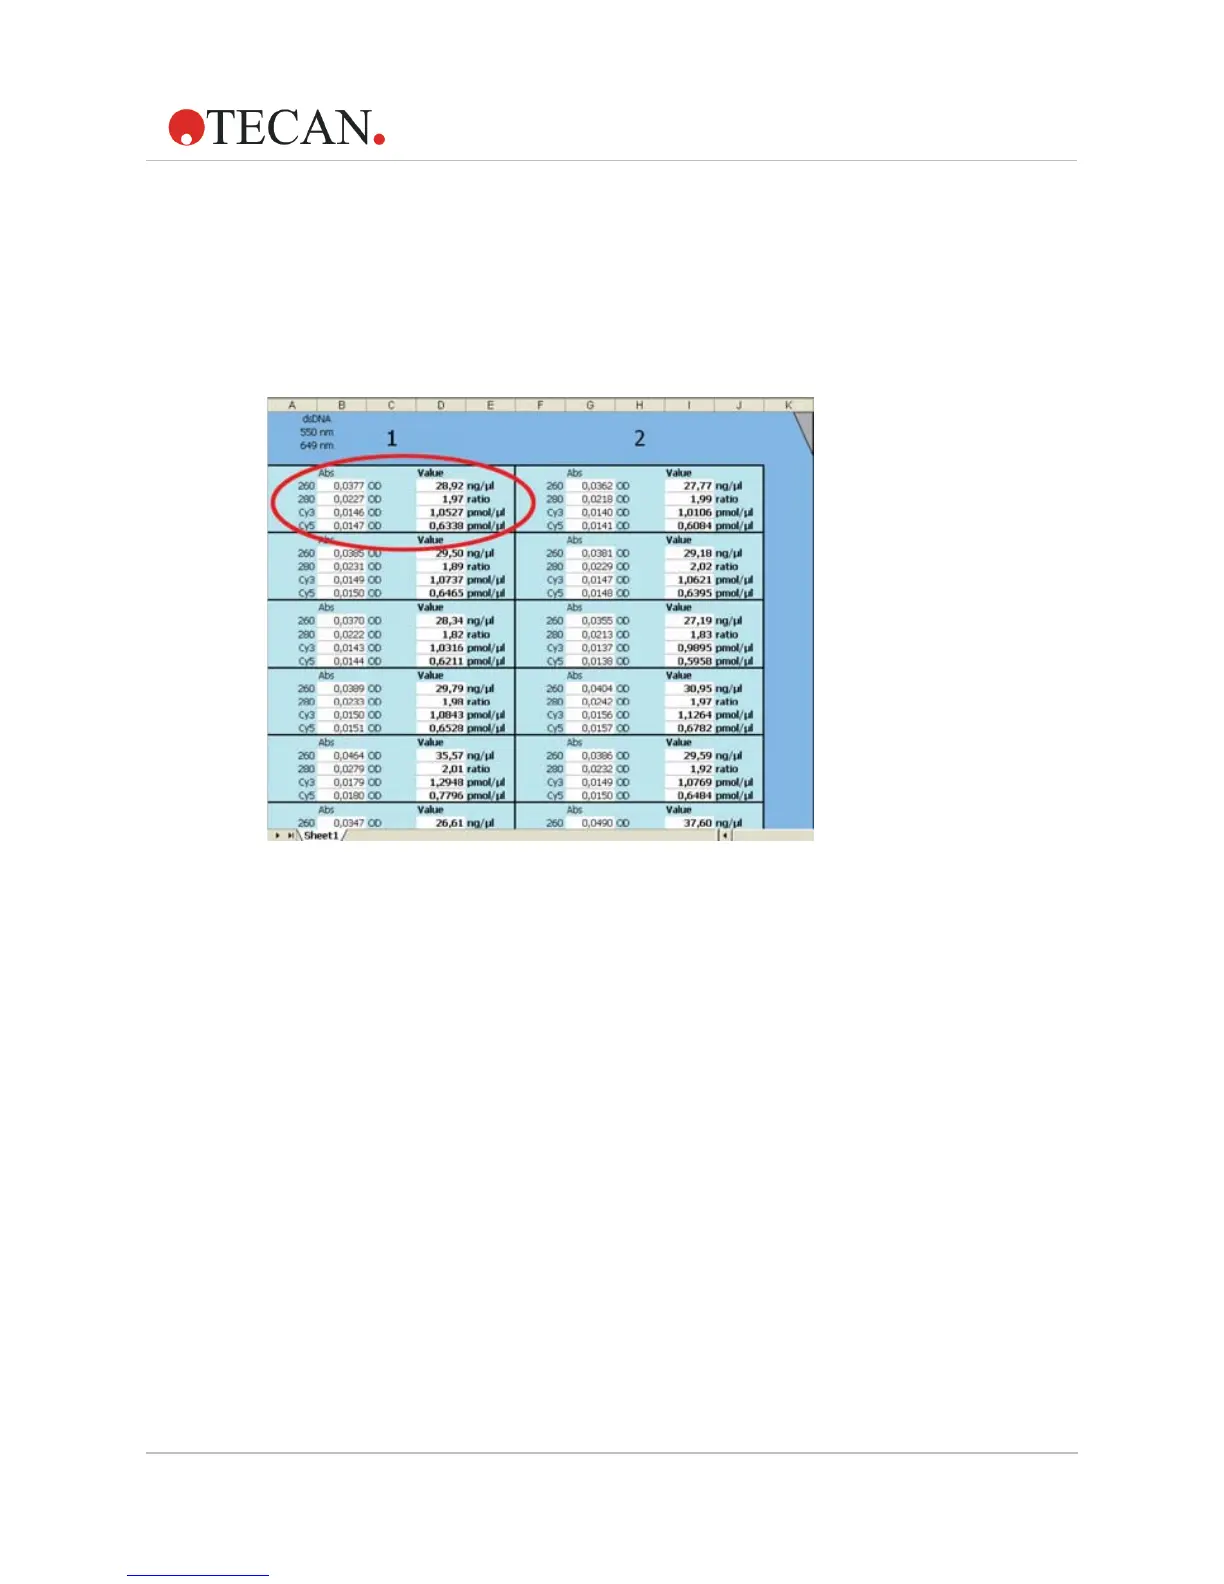
16. As the measurement is performed an Excel sheet opens automatically
in the background. All measurement results (including the
automatically calculated nucleic acid concentration, the 260/280 ratio,
and for Labeling Efficiency measurements, the dye concentration) are
concisely displayed in a matrix (analogous to the plate layout). The
OD values of each sample at all relevant wavelengths are also
displayed.
Figure 3: Overview of Excel result sheet
17. Once the measurement procedure is finished, the plate is moved out
automatically. A pop-up message appears, asking if the user wishes
to perform another measurement.
• If additional (identical) measurements are to be performed, wipe
o any sample residues from the previous measurement and
apply new samples. Click
Yes to start the measurement.
• If no further measurement is to be performed, click No. An extra
sheet appears in the Excel workbook summarizing the results of
all previous measurements.