EasyManuals Logo

Technics RS-M7 Service Manual

Technics RS-M7
15 pages
To Next Page IconTo Next Page
To Previous Page IconTo Previous Page
Page #9 background imageLoading...
Page #9 background image
ITEM
MEASUREMENT
&
ADJUSTMENT
Overall
gain
Condition:
«
Record/playback
mode
*
Input
level
control
---
MAX
*
Standard
input
level;
MIC
«+s
eee
—72+£3dB
LINE
IN---
—24+3dB
Equipment:
*
AF
oscillator
«VTVM
«
Oscilloscope
*
ATT
«
Test
tape
(reference
blank
tape)
---QZ7ZCRA
for
Normal
Level
meter
Condition:
*
Record
mode
*
Input
level
control
---
MAX
Equipment:
*VTVM_
*
Oscilloscope
*
AF
oscillator
*
ATT
Overall
frequency
response
Condition:
*
Record/playback
mode
*
Input
level
control
---
MAX
Equipment:
*
VTVM
*
AF
oscillator
*
ATT
*
Test
tape
(reference
blank
tape)
---
QZZCRA
for
Normal
--+
QZZCRX
for
CrOz
---
Q7ZCRY
for
Fe-Cr
.
Adjust
ATT
until
monitor
level
at
LINE
OUT
becomes
0.39
V.
LINE
IN
.
Using
test
tape,
make
recording.
.
Playback
recorded
tape,
and
make
sure
the
value
at
LINE
OUT
_
lf
measured
value
is
not
0.39
V,
adjust
VR5
(L-CH),
VR6
_
Adjust
ATT
so
that
the
monitor
level
at
LINE
OUT
becomes
.
Adjust
VR501
(L-CH)
and
VR502
(R-CH)
so
that
the
level
.
Test
equipment
connection
is
.
Load
reference
blank
test
tape
and
.
Playback
and
express
in
dB
the
.
Test
equipment
connection
is
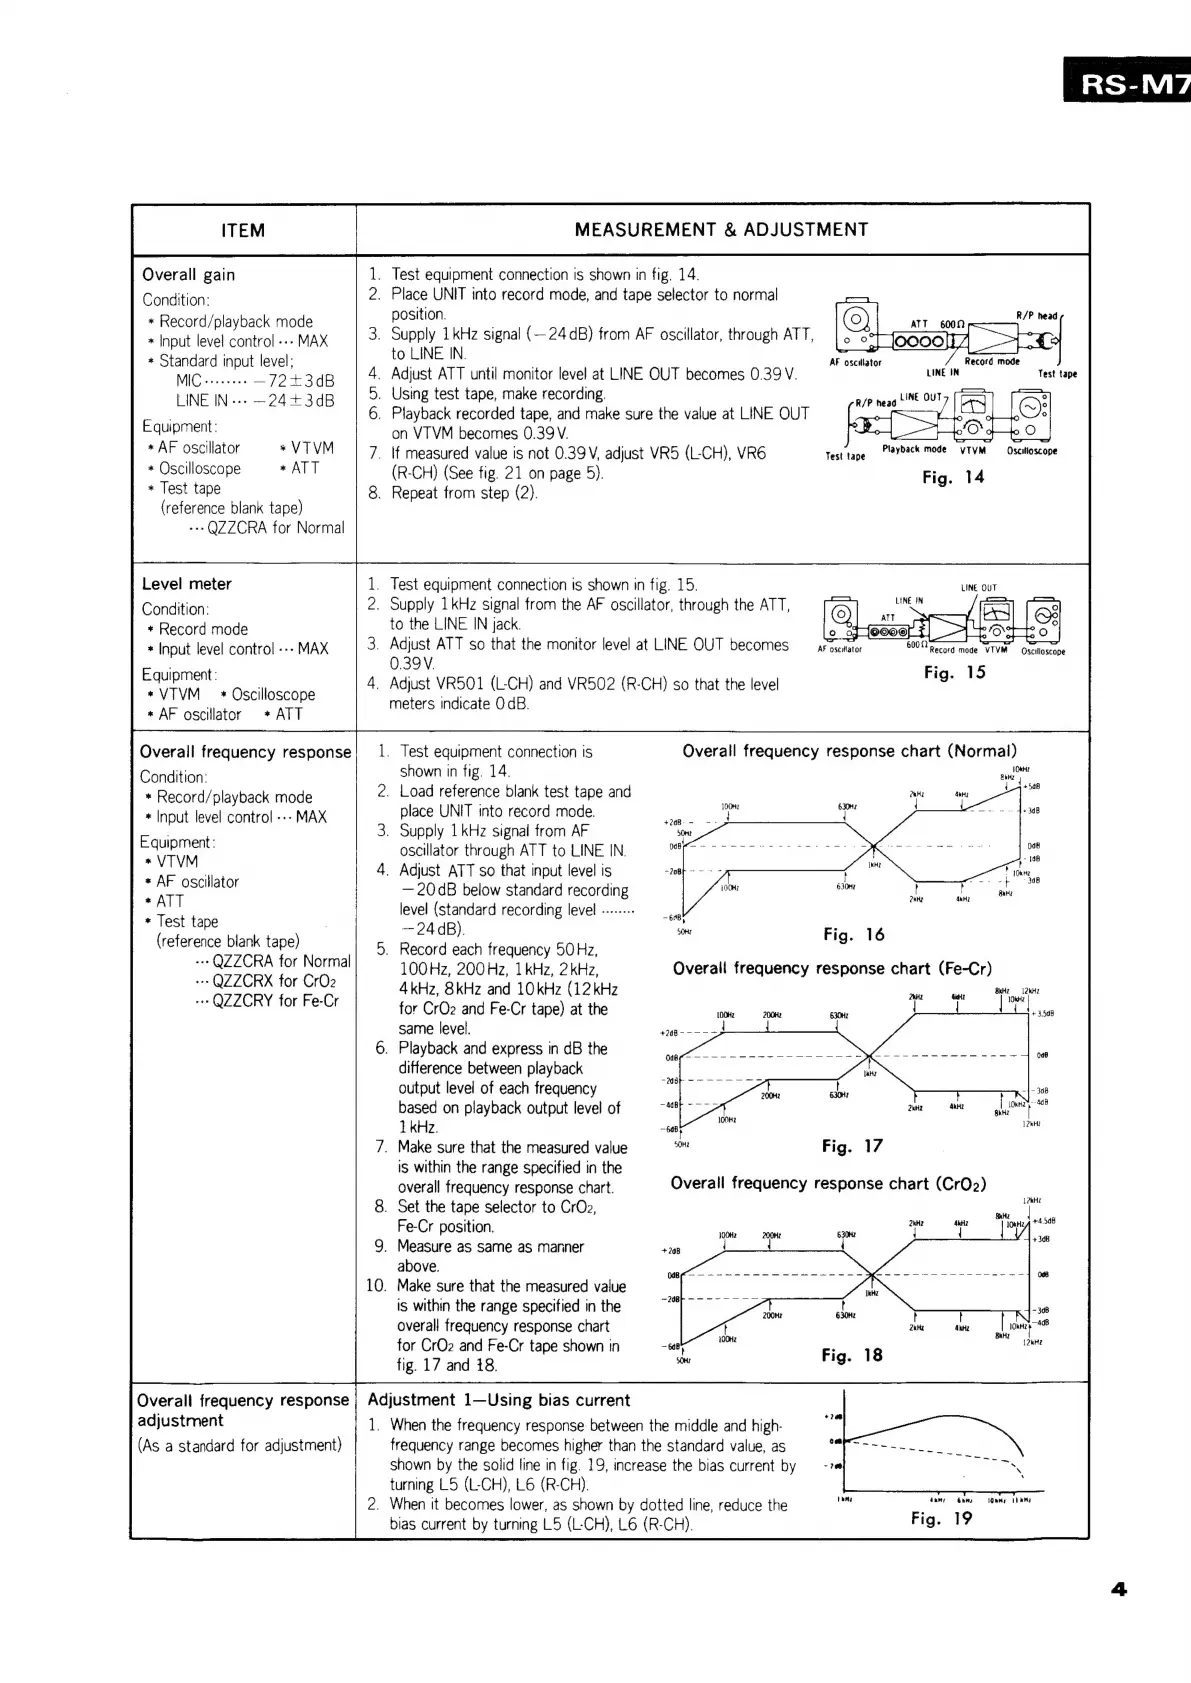
shown
in
fig.
14.
.
Place
UNIT
into
record
mode,
and
tape
selector
to
normal
position.
.
Supply
1
kHz
signal
(—24
dB)
from
AF
oscillator,
through
ATT,
to
LINE
IN.
AF
oscillator
Record
mode
Test
tape
R/P
head
LINE
OUT
on
VIVM
becomes
0.39
V.
Playback
mode
yTVM
Oscilloscope
Fig.
14
Test
tape
(R-CH)
(See
fig.
21
on
page
5).
.
Repeat
from
step
(2).
_
Test
equipment
connection
is
shown
in
fig.
15.
LINE
OUT
.
Supply
1kHz
signal
from
the
AF
oscillator,
through
the
ATT,
to
the
LINE
IN
jack.
AF
oscatator
0.39V
Fig.
15
meters
indicate
O
dB.
Overall
frequency
response
chart
(Normal)
shown
in
fig.
14.
am
14+
d8
place
UNIT
into
record
mode.
Pas
+368
.
Supply
1kHz
signal
from
AF
oscillator
through
ATT
to
LINE
IN.
.
Adjust
ATT
so
that
input
level
is
20dB
below
standard
recording
level
(standard
recording
level
—24
dB).
Fig.
16
.
Record
each
frequency
50
Hz,
100Hz,
200Hz,
1kHz,
2
kHz,
Overall
frequency
response
chart
(Fe-Cr)
4kHz,
8kHz
and
10kHz
(12kHz
a
ee
for
CrOz
and
Fe-Cr
tape)
at
the
|
ew
same
level.
+
3.508
difference
between
playback
output
level
of
each
frequency
based
on
playback
output
level
of
808
2kHE
WH?
oo
1
kHz.
.
Make
sure
that
the
measured
value
is
within
the
range
specified
in
the
overall
frequency
response
chart.
.
Set
the
tape
selector
to
CrOz,
Fe-Cr
position.
.
Measure
as
same
as
manner
above.
.
Make
sure
that
the
measured
value
is
within
the
range
specified
in
the
overall
frequency
response
chart
for
CrOQ2
and
Fe-Cr
tape
shown
in
fig.
17
and
18.
Overall
frequency
response
;
Adjustment
1—Using
bias
current
adjustment
(As
a
standard
for
adjustment)
12hH2
Fig.
17
Overall
frequency
response
chart
(CrO2)
2kHz
AH?
;
{
1.
When
the
frequency
response
between
the
middle
and
high-
frequency
range
becomes
higher
than
the
standard
value,
as
shown
by
the
solid
line
in
fig.
19,
increase
the
bias
current
by
turning
L5
(L-CH),
L6
(R-CH).
2.
When
it
becomes
lower,
as
shown
by
dotted
line,
reduce
the
bias
current
by
turning
L5
(L-CH),
L6
(R-CH).
dame
baw
iQenm;
|
bare
Fig.
19

Questions and Answers:

Question and Answer IconNeed help?

Do you have a question about the Technics RS-M7 and is the answer not in the manual?

Technics RS-M7 Specifications

General IconGeneral
BrandTechnics
ModelRS-M7
CategoryCassette Player
LanguageEnglish

Related product manuals