Analyze Wavefor
mData
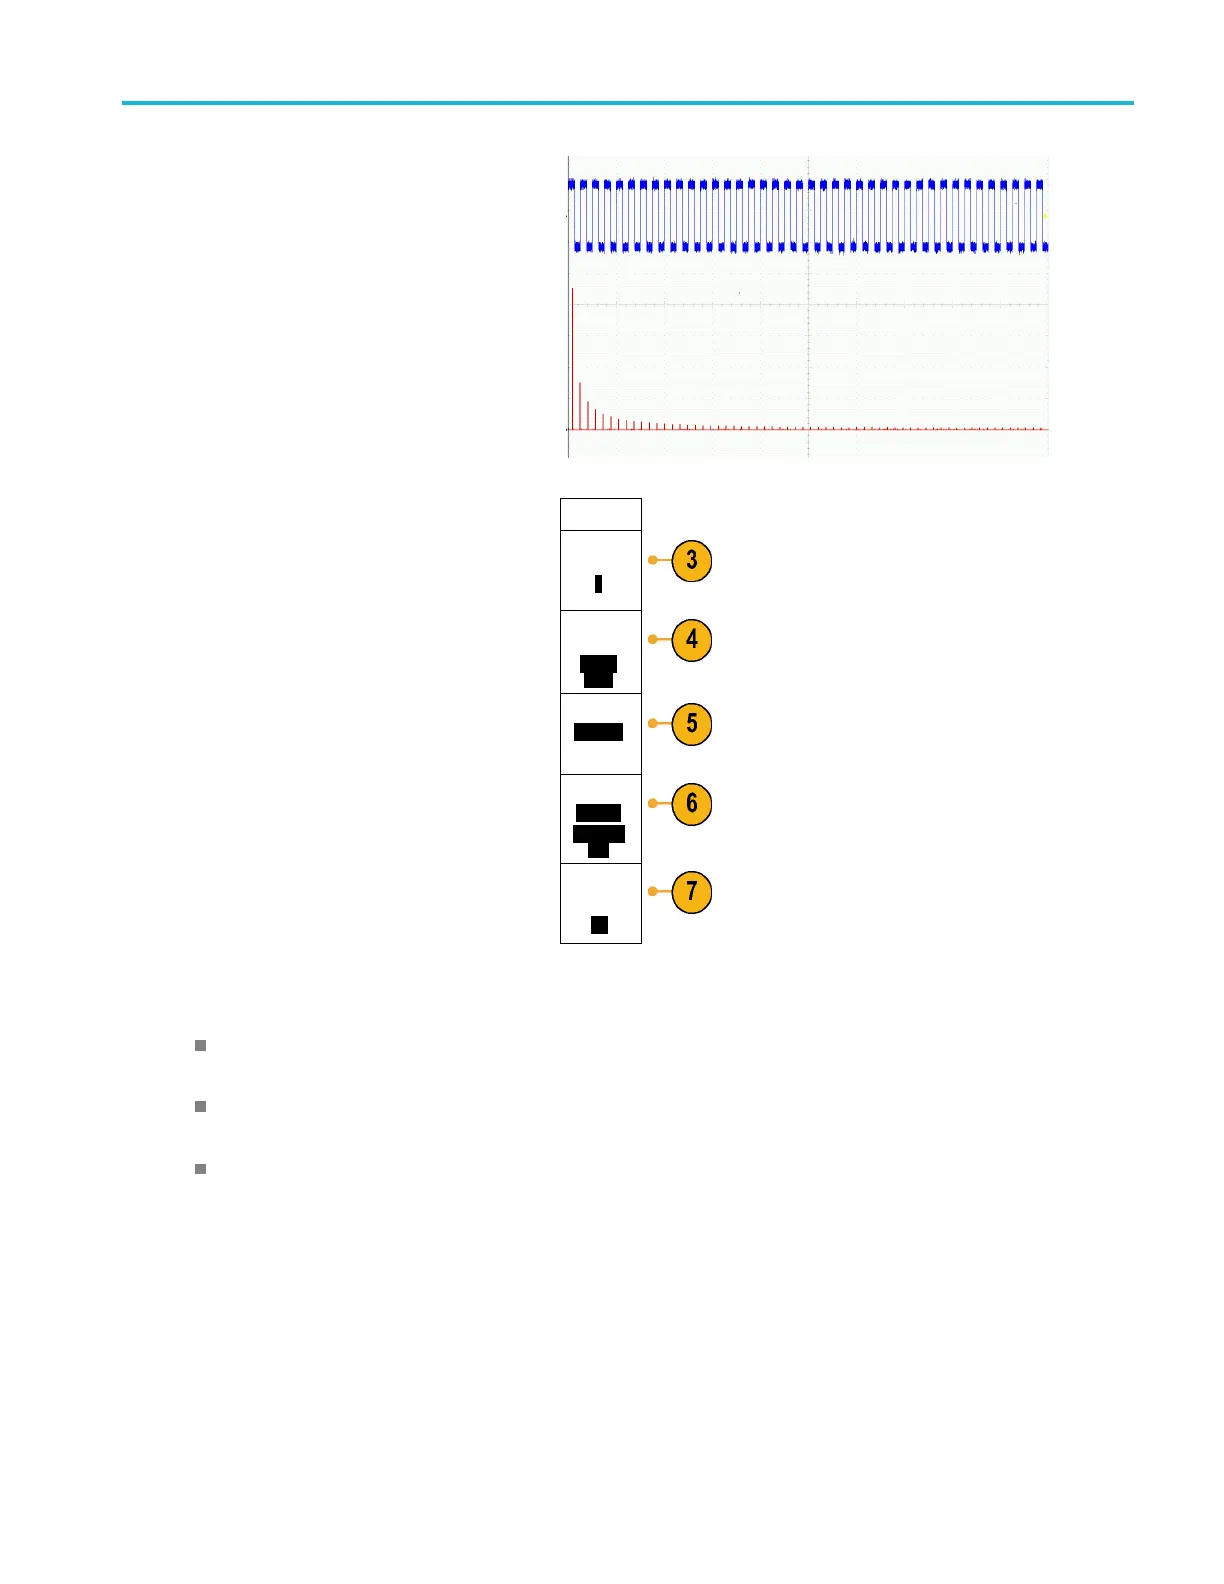
The FFT will app
ear on the display.
FFT
3. Push the side-bezel menu FFT Source
button and turn multipurpose knob a to set
the source to channel 1, 2, 3,orto4.
FFT
Source
1
4. Push Vertical Units and turn multipurpose
knob a to select dBV RMS or Linear RMS.
Vertical
Units
Linear
RMS
5. Push Wind ow and turn multipurpose knob a
to select Rectangular, Hamming, Hanning,
or B lackman-Harris.
Window
Hanning
6. Push the side-bezel Horizontal button to
activate multipurpose knobs a and b to pan
and zoom the FFT display.
Horizontal
625kHz
1.25kHz-
/div
7. Push the side-bezel Gating Indicators
button to activate the visual gating indicators,
which show the FFT area of analysis.
Gating
Indicators
On |
Off
These are some important details about operating the FFT feature on this oscilloscope:
The area of the source waveform used to calculate the FFT i s usually slightly less than one screen width of data. To
see this area, turn on the gating indicators.
The FFT is calculated from 5,000 points (typical) of the source waveform. When the input area contains more than 5,000
points, the area is reduced in resolution (that is, the number of samples is reduced).
When the input area is off the screen, the FFT cannot be calculated. To display your waveform on screen, push Acq uir e
-> Set Horiz. Position to 0s.
Aliasing
Th
e largest frequency in the FFT spectrum is called the Nyquist frequency. Frequency components above the Nyquist
frequency will appear on screen to be below the Nyquist frequency. Th is is called aliasing. To eliminate aliases, try the
following remedies:
MSO2000B and DPO2000B Series Oscilloscopes User Manual 101
 Loading...