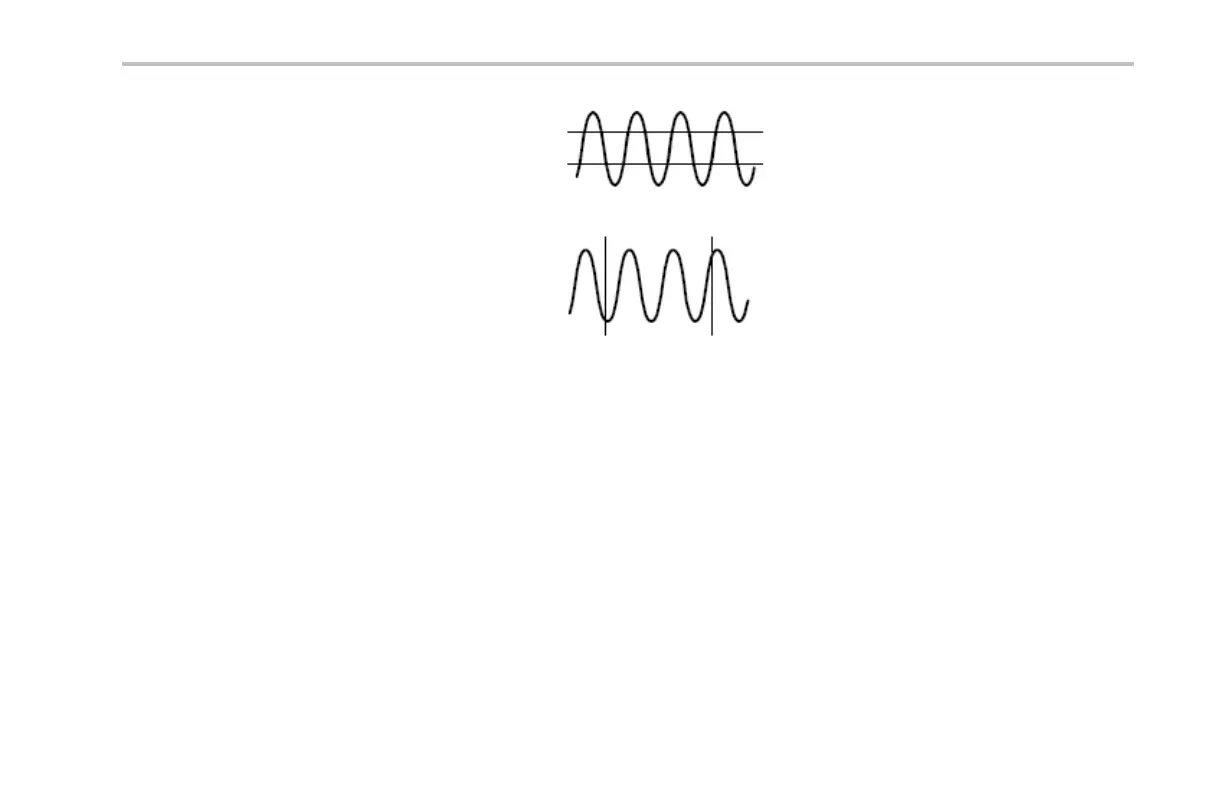
Analyze Waveform Data
The horizontal cursor lines on the d isplay
measure the vertical parameters, typically
voltage.
The vertical cursor lines on the display measure
horizontal parameters, typically time.
The square and circle shapes in the readout map to the multipurpose knobs when both vertical and horizontal cursors are present.
Using XY Cursors
When the XY Display mode is on, the cursor readouts will appear to the righ t of the lower graticule (XY). You can choose which
readouts to display: rectangular, polar, product, or ratio.
Using Math Waveforms
Create math waveforms to support the analysis of your channel and reference waveforms. By combining and tra nsforming so urce
waveforms and other da ta into math waveforms, you can derive the data view that your app lication requires.
DPO2000 and MSO2000 Series Oscilloscopes User Man ual 193
 Loading...